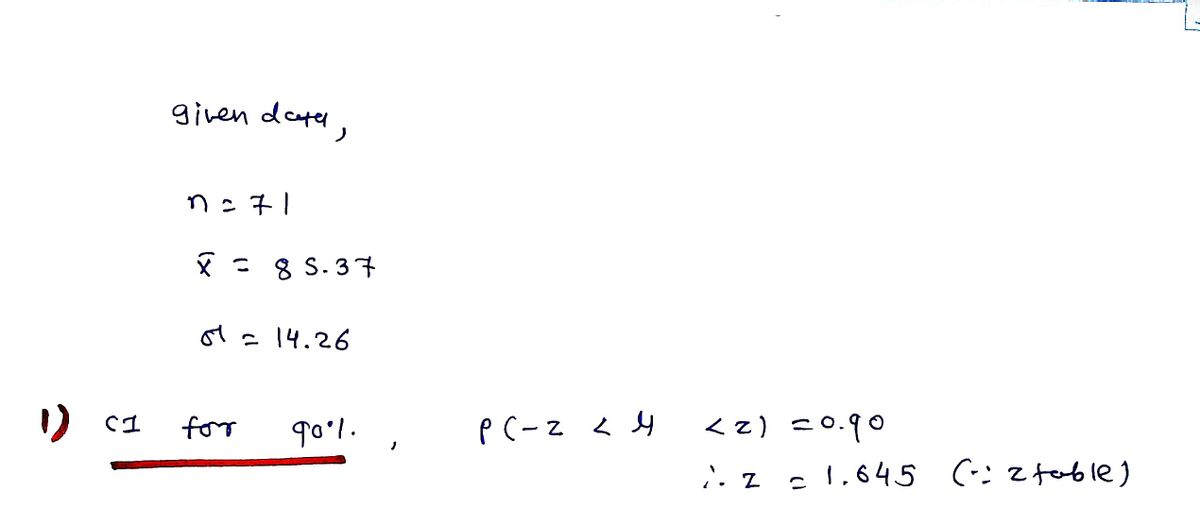
You are given the sample mean and the population standard deviation. Use this information to construct the 90% and 95% confidence intervals for the population mean. Interpret the results and compare the widths of the confidence intervals. From a random sample of 71 dates, the mean record high daily temperature in a certain city has a mean of 85.37°F. Assume the population standard deviation is 14.26°F. The 90% confidence interval is ( ). (Round to two decimal places as needed.)
You are given the sample mean and the population standard deviation. Use this information to construct the 90% and 95% confidence intervals for the population mean. Interpret the results and compare the widths of the confidence intervals. From a random sample of 71 dates, the mean record high daily temperature in a certain city has a mean of 85.37°F. Assume the population standard deviation is 14.26°F. The 90% confidence interval is ( ). (Round to two decimal places as needed.)
A First Course in Probability (10th Edition)
10th Edition
ISBN:9780134753119
Author:Sheldon Ross
Publisher:Sheldon Ross
Chapter1: Combinatorial Analysis
Section: Chapter Questions
Problem 1.1P: a. How many different 7-place license plates are possible if the first 2 places are for letters and...
Related questions
Question
Answer these question
![The image contains a statistical exercise from Pearson Education. It instructs you to use the sample mean and the population standard deviation to construct 90% and 95% confidence intervals for the population mean, then interpret the results and compare the widths of these intervals.
**Exercise details:**
- Sample size: 71 dates
- Mean record high daily temperature: 85.37°F
- Population standard deviation: 14.26°F
**Task:**
- Calculate the 90% confidence interval.
**Response Area:**
The 90% confidence interval is [ , ]. (Round to two decimal places as needed.)
**Additional Features:**
- Buttons for "Help Me Solve This," "View an Example," and "Get More Help."
- A "Check Answer" button on the right.
- Copyright information: © 2021 Pearson Education Inc. All rights reserved. Links to Terms of Use, Privacy Policy, Permissions, and Contact Us.
No graphs or diagrams are present in the image.](/v2/_next/image?url=https%3A%2F%2Fcontent.bartleby.com%2Fqna-images%2Fquestion%2Fdabeff17-6e30-4e7b-b604-e664e91c4527%2Fcc06b5e8-821d-4466-942f-bc6d4153a278%2Fodz38tg_processed.jpeg&w=3840&q=75)
Transcribed Image Text:The image contains a statistical exercise from Pearson Education. It instructs you to use the sample mean and the population standard deviation to construct 90% and 95% confidence intervals for the population mean, then interpret the results and compare the widths of these intervals.
**Exercise details:**
- Sample size: 71 dates
- Mean record high daily temperature: 85.37°F
- Population standard deviation: 14.26°F
**Task:**
- Calculate the 90% confidence interval.
**Response Area:**
The 90% confidence interval is [ , ]. (Round to two decimal places as needed.)
**Additional Features:**
- Buttons for "Help Me Solve This," "View an Example," and "Get More Help."
- A "Check Answer" button on the right.
- Copyright information: © 2021 Pearson Education Inc. All rights reserved. Links to Terms of Use, Privacy Policy, Permissions, and Contact Us.
No graphs or diagrams are present in the image.
Expert Solution
Step 1

Step by step
Solved in 2 steps with 2 images

Recommended textbooks for you

A First Course in Probability (10th Edition)
Probability
ISBN:
9780134753119
Author:
Sheldon Ross
Publisher:
PEARSON


A First Course in Probability (10th Edition)
Probability
ISBN:
9780134753119
Author:
Sheldon Ross
Publisher:
PEARSON
