Year of Education would be expected to count less than 9 years?

A First Course in Probability (10th Edition)
10th Edition
ISBN:9780134753119
Author:Sheldon Ross
Publisher:Sheldon Ross
Chapter1: Combinatorial Analysis
Section: Chapter Questions
Problem 1.1P: a. How many different 7-place license plates are possible if the first 2 places are for letters and...
icon
Related questions
Question

What probability of the Year of Education would be expected to count less than 9 years? (Round off to three decimal places if necessary)

### Table 1: Data from Random Sampling

This table presents a dataset from a random sampling, covering several variables: Monthly Income, Marital Status, Years of Education, Type of Punishment, and Sentence Year. Each row represents specific data points for an individual sample.

#### Variables Explained:

- **Monthly Income ($1,000):** Indicates the monthly income in thousands of dollars.
- **Marital Status:** Encoded as numerical values representing different marital statuses.
- **Year of Education:** The number of years of education completed by the individual.
- **Type of Punishment:** Encoded as numerical values representing different types of punishment.
- **Sentence Year:** Indicates the length of the sentence in years.

#### Data Points:

| **Monthly Income ($1,000)** | **Marital Status** | **Year of Education** | **Type of Punishment** | **Sentence Year** |
|-----------------------------|--------------------|-----------------------|------------------------|-------------------|
| 1.8                         | 2                  | 8                     | 2                      | 8                 |
| 2.3                         | 3                  | 7                     | 1                      | 9                 |
| 2.5                         | 1                  | 10                    | 2                      | 18                |
| 2.3                         | 1                  | 9                     | 1                      | 22                |
| 1.9                         | 2                  | 14                    | 1                      | 8                 |
| 1.9                         | 1                  | 11                    | 1                      | 15                |
| 1.9                         | 2                  | 14                    | 2                      | 20                |
| 2.1                         | 3                  | 12                    | 1                      | 6                 |
| 1.9                         | 2                  | 7                     | 1                      | 15                |
| 2.1                         | 2                  | 10                    | 3                      | 9                 |
| 2.1                         | 3                  | 12                    | 2                      | 19                |
| 2.0                         | 1                  | 8                     | 2                      | 14                |
| 2.6                         | 2                  | 8                     | 2                      | 13                |
| 2.
Transcribed Image Text:### Table 1: Data from Random Sampling This table presents a dataset from a random sampling, covering several variables: Monthly Income, Marital Status, Years of Education, Type of Punishment, and Sentence Year. Each row represents specific data points for an individual sample. #### Variables Explained: - **Monthly Income ($1,000):** Indicates the monthly income in thousands of dollars. - **Marital Status:** Encoded as numerical values representing different marital statuses. - **Year of Education:** The number of years of education completed by the individual. - **Type of Punishment:** Encoded as numerical values representing different types of punishment. - **Sentence Year:** Indicates the length of the sentence in years. #### Data Points: | **Monthly Income ($1,000)** | **Marital Status** | **Year of Education** | **Type of Punishment** | **Sentence Year** | |-----------------------------|--------------------|-----------------------|------------------------|-------------------| | 1.8 | 2 | 8 | 2 | 8 | | 2.3 | 3 | 7 | 1 | 9 | | 2.5 | 1 | 10 | 2 | 18 | | 2.3 | 1 | 9 | 1 | 22 | | 1.9 | 2 | 14 | 1 | 8 | | 1.9 | 1 | 11 | 1 | 15 | | 1.9 | 2 | 14 | 2 | 20 | | 2.1 | 3 | 12 | 1 | 6 | | 1.9 | 2 | 7 | 1 | 15 | | 2.1 | 2 | 10 | 3 | 9 | | 2.1 | 3 | 12 | 2 | 19 | | 2.0 | 1 | 8 | 2 | 14 | | 2.6 | 2 | 8 | 2 | 13 | | 2.
### Types of Punishment

1. **Probation/Community Service**
2. **Jail Incarceration**
3. **Prison Incarceration**

### Marital Status

1. **Married**
2. **Single**
3. **Other**

This table categorizes types of punishments ranging from community-based sentences to more severe forms of incarceration. Additionally, it provides a simple classification of marital status which may be used for demographic analysis in criminology studies.
Transcribed Image Text:### Types of Punishment 1. **Probation/Community Service** 2. **Jail Incarceration** 3. **Prison Incarceration** ### Marital Status 1. **Married** 2. **Single** 3. **Other** This table categorizes types of punishments ranging from community-based sentences to more severe forms of incarceration. Additionally, it provides a simple classification of marital status which may be used for demographic analysis in criminology studies.
Expert Solution
Step 1
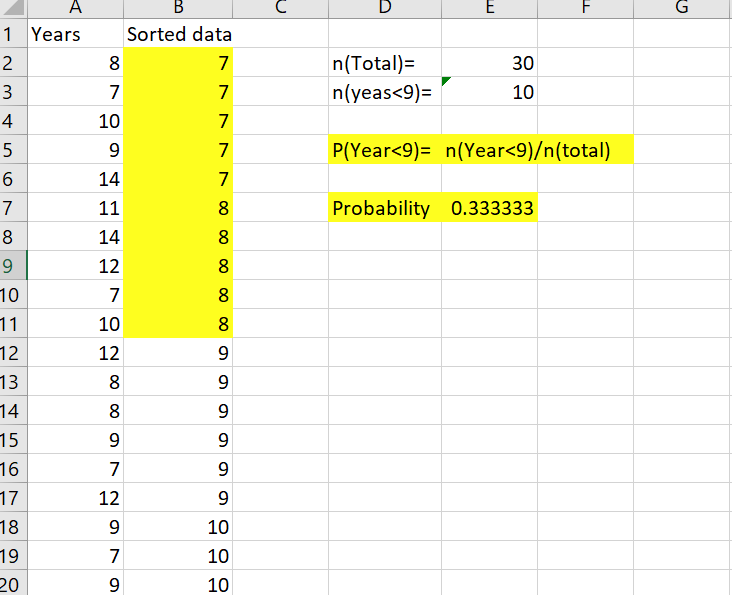
Probability homework question answer, step 1, image 1

steps

Step by step

Solved in 2 steps with 1 images

Blurred answer
Recommended textbooks for you
A First Course in Probability (10th Edition)
Probability
ISBN:
9780134753119
Author:
Sheldon Ross
Publisher:
PEARSON
A First Course in Probability
Probability
ISBN:
9780321794772
Author:
Sheldon Ross
Publisher:
PEARSON