yai ayu, au uiaı uie iwu aapico aI IIupcInuc J pi IaIuvII apico ocicLICu 1VIITIVILIany uiouIvulcu pupuiauvilo. vV IIVI aoou C uiaı ui pupuiaivn olanuaru deviations are equal. Does it appear that the mean time interval has changed? Is the conclusion affected by whether the significance level is 0.10 or 0.01? 78 92 89 78 57 99 63 87 71 88 83 84 55 82 75 10 62 Recent Past 88 89 93 94 64 86 85 92 88 91 88 91 Calculate the test statistic. (Round to two decimal places as needed.)

Solution:
Null and alternative hypotheses:
The null and alternative hypotheses to test is given below:
Null hypothesis:
H0: µ1 = µ2
That is, mean time for recent and past group are same.
Alternative hypothesis:
H1: µ1 ≠ µ2
That is, mean time for recent and past group are not same.
Computation of test statistic:
To test whether the mean time interval has changed, the appropriate test is independent samples t-test.
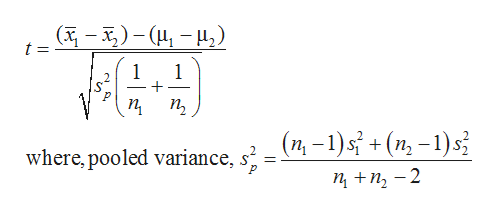
The formula for independent samples t-test is shown below.

Calculation of t-statistic:
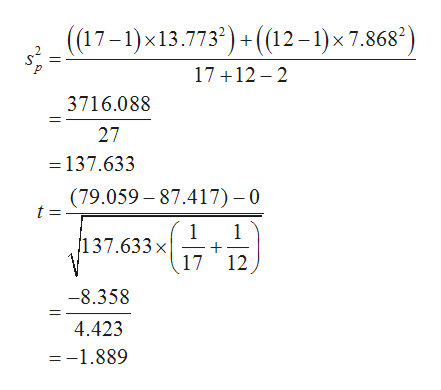
Here, x1-bar is 79.059 and x2-bar is 87.417, s1 is 13.773 and s2 is 7.868, n1 is 17, and n2 is 12. The value of (µ1 − µ2) is 0.
The test statistic value is |t| = 1.889 by substituting the values in t-statistic formula.

Step by step
Solved in 5 steps with 2 images


