X y 46.6 156.6 43.7 71.6 49.5 57.4 -0.6 -12.3 17.2 25.7 55.2 39.1 -0.7 27.5 23.1 35.4 34.5 42.3 24.8 47.6 -5.5 -9.3 -8.8 145.8 42.7 75.6 19.5 5.6 23.3 77.2 13.1 10.5 2.3 -10.4 24.1 39.2 r = 61.8 42.5 53.2 Find the correlation coefficient and round it to two decimal places. What percentage of the variation in y can be explained by the variation in the values of x? Round to one decimal place. R² =
X y 46.6 156.6 43.7 71.6 49.5 57.4 -0.6 -12.3 17.2 25.7 55.2 39.1 -0.7 27.5 23.1 35.4 34.5 42.3 24.8 47.6 -5.5 -9.3 -8.8 145.8 42.7 75.6 19.5 5.6 23.3 77.2 13.1 10.5 2.3 -10.4 24.1 39.2 r = 61.8 42.5 53.2 Find the correlation coefficient and round it to two decimal places. What percentage of the variation in y can be explained by the variation in the values of x? Round to one decimal place. R² =

MATLAB: An Introduction with Applications
6th Edition
ISBN:9781119256830
Author:Amos Gilat
Publisher:Amos Gilat
Chapter1: Starting With Matlab
Section: Chapter Questions
Problem 1P

Related questions
Question
![## Data Analysis Exercise
### Data Table
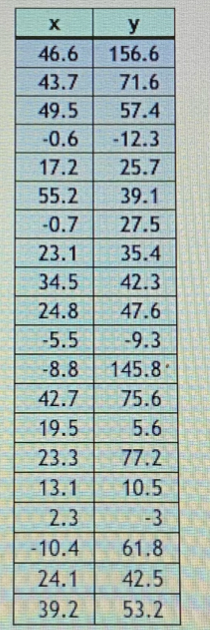
The table below displays paired data for variables \( x \) and \( y \):
| x | y |
|-------|--------|
| 46.6 | 156.6 |
| 43.7 | 71.6 |
| 49.5 | 57.4 |
| -0.6 | -12.3 |
| 17.2 | 25.7 |
| 55.2 | 39.1 |
| -0.7 | 27.5 |
| 23.1 | 35.4 |
| 34.5 | 42.3 |
| 24.8 | 47.6 |
| -5.5 | -9.3 |
| -8.8 | 145.8 |
| 42.7 | 75.6 |
| 19.5 | 5.6 |
| 23.3 | 77.2 |
| 13.1 | 10.5 |
| 2.3 | -3 |
| -10.4 | 61.8 |
| 24.1 | 42.5 |
| 39.2 | 53.2 |
### Instructions
1. **Find the correlation coefficient (r):**
- Calculate the correlation coefficient for the data set.
- Round your answer to two decimal places.
\[
r = \text{[Text Box]}
\]
2. **R-squared Value (\( R^2 \)) Calculation:**
- Determine what percentage of the variation in \( y \) can be explained by the variation in the values of \( x \).
- Round your answer to one decimal place.
\[
R^2 = \text{[Text Box]} \%
\]
### Diagram Explanation
- This data is usually graphed as a scatter plot to visually assess the relationship between \( x \) and \( y \).
- Consider calculating the best-fit line to see how the values actually group and fit.
By understanding these relationships, you can conduct more in-depth analysis and draw meaningful conclusions from the data.](/v2/_next/image?url=https%3A%2F%2Fcontent.bartleby.com%2Fqna-images%2Fquestion%2F97b5df25-1667-438a-b46e-c2a0d1ae7c86%2F522625de-8f6f-4815-be9d-ee0fdefb1bcc%2Ff5pkyph_processed.jpeg&w=3840&q=75)
Transcribed Image Text:## Data Analysis Exercise
### Data Table
The table below displays paired data for variables \( x \) and \( y \):
| x | y |
|-------|--------|
| 46.6 | 156.6 |
| 43.7 | 71.6 |
| 49.5 | 57.4 |
| -0.6 | -12.3 |
| 17.2 | 25.7 |
| 55.2 | 39.1 |
| -0.7 | 27.5 |
| 23.1 | 35.4 |
| 34.5 | 42.3 |
| 24.8 | 47.6 |
| -5.5 | -9.3 |
| -8.8 | 145.8 |
| 42.7 | 75.6 |
| 19.5 | 5.6 |
| 23.3 | 77.2 |
| 13.1 | 10.5 |
| 2.3 | -3 |
| -10.4 | 61.8 |
| 24.1 | 42.5 |
| 39.2 | 53.2 |
### Instructions
1. **Find the correlation coefficient (r):**
- Calculate the correlation coefficient for the data set.
- Round your answer to two decimal places.
\[
r = \text{[Text Box]}
\]
2. **R-squared Value (\( R^2 \)) Calculation:**
- Determine what percentage of the variation in \( y \) can be explained by the variation in the values of \( x \).
- Round your answer to one decimal place.
\[
R^2 = \text{[Text Box]} \%
\]
### Diagram Explanation
- This data is usually graphed as a scatter plot to visually assess the relationship between \( x \) and \( y \).
- Consider calculating the best-fit line to see how the values actually group and fit.
By understanding these relationships, you can conduct more in-depth analysis and draw meaningful conclusions from the data.
Expert Solution
Step 1
Given:

Step by step
Solved in 3 steps with 3 images

Recommended textbooks for you
MATLAB: An Introduction with Applications
Statistics
ISBN:
9781119256830
Author:
Amos Gilat
Publisher:
John Wiley & Sons Inc

Probability and Statistics for Engineering and th…
Statistics
ISBN:
9781305251809
Author:
Jay L. Devore
Publisher:
Cengage Learning

Statistics for The Behavioral Sciences (MindTap C…
Statistics
ISBN:
9781305504912
Author:
Frederick J Gravetter, Larry B. Wallnau
Publisher:
Cengage Learning
MATLAB: An Introduction with Applications
Statistics
ISBN:
9781119256830
Author:
Amos Gilat
Publisher:
John Wiley & Sons Inc
Probability and Statistics for Engineering and th…
Statistics
ISBN:
9781305251809
Author:
Jay L. Devore
Publisher:
Cengage Learning
Statistics for The Behavioral Sciences (MindTap C…
Statistics
ISBN:
9781305504912
Author:
Frederick J Gravetter, Larry B. Wallnau
Publisher:
Cengage Learning

Elementary Statistics: Picturing the World (7th E…
Statistics
ISBN:
9780134683416
Author:
Ron Larson, Betsy Farber
Publisher:
PEARSON

The Basic Practice of Statistics
Statistics
ISBN:
9781319042578
Author:
David S. Moore, William I. Notz, Michael A. Fligner
Publisher:
W. H. Freeman

Introduction to the Practice of Statistics
Statistics
ISBN:
9781319013387
Author:
David S. Moore, George P. McCabe, Bruce A. Craig
Publisher:
W. H. Freeman