Why was the variable “# of customer service representatives” dropped from the model? Write the regression equation. Sales of men’s clothing (predicted) = Are the regression coefficients significantly different from 0? If one mails 10,000
Why was the variable “# of customer service representatives” dropped from the model? Write the regression equation. Sales of men’s clothing (predicted) = Are the regression coefficients significantly different from 0? If one mails 10,000

MATLAB: An Introduction with Applications
6th Edition
ISBN:9781119256830
Author:Amos Gilat
Publisher:Amos Gilat
Chapter1: Starting With Matlab
Section: Chapter Questions
Problem 1P

Related questions
Question
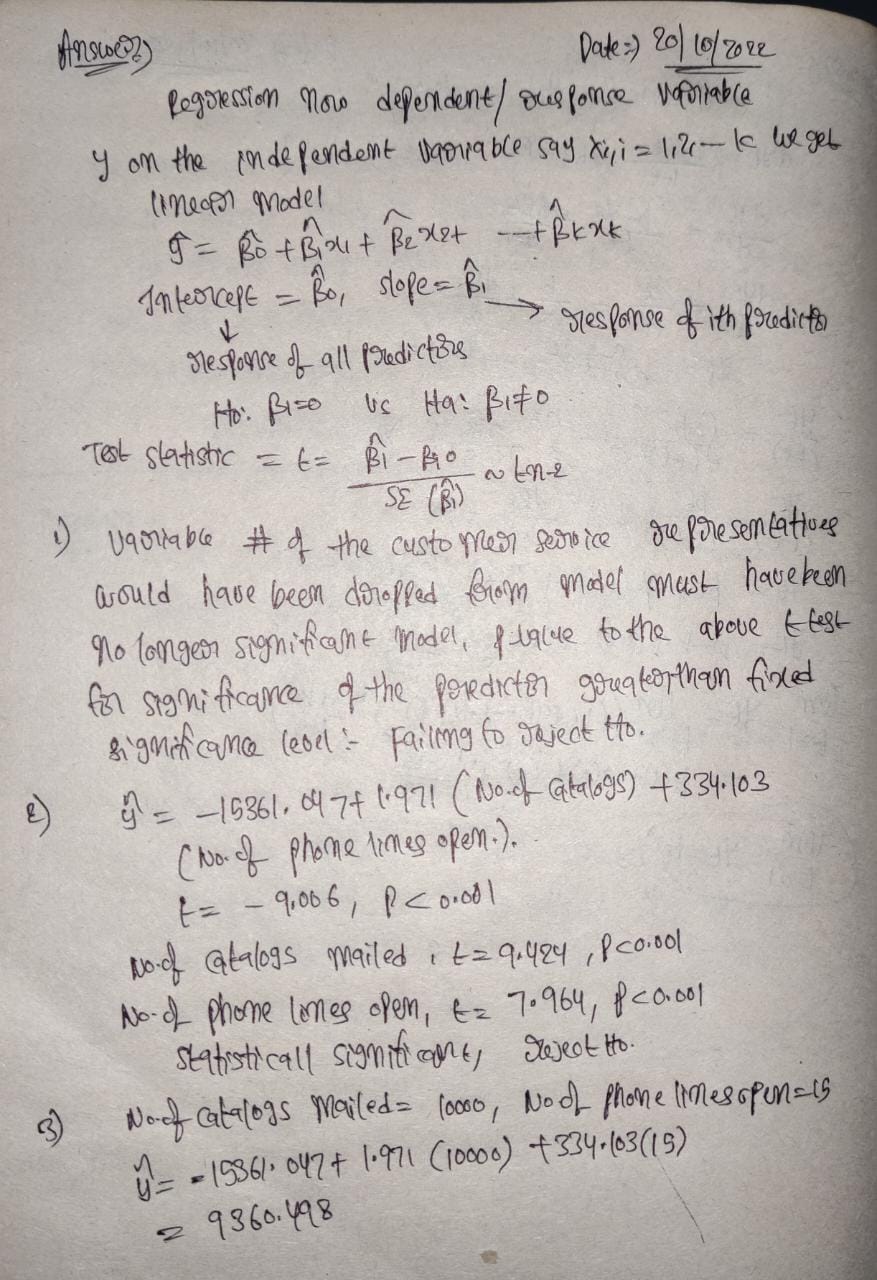
- Why was the variable “# of customer service representatives” dropped from the model?
- Write the regression equation.
Sales of men’s clothing (predicted) =
- Are the regression coefficients significantly different from 0?
- If one mails 10,000 catalogs and has 15 phone lines open, what would the predicted sales of men’s clothing be?
- How would you interpret the regression coefficient for number of catalogs mailed?
- What is the final R2 of the model? How would you interpret this?
- Which of the two independent variables is the most important predictor of the dependent variable? Why?

Transcribed Image Text:### Model Summary
| Model | R | R Square | Adjusted R Square | Std. Error of the Estimate | R Square Change | F Change | df1 | df2 | Sig. F Change |
|-------|-------|----------|--------------------|----------------------------|-----------------|-----------|-----|-----|---------------|
| 1 | .803a | .645 | .642 | 3785.49685 | .645 | 214.216 | 1 | 118 | .000 |
| 2 | .877b | .770 | .766 | 3061.36064 | .125 | 63.426 | 1 | 117 | .000 |
a. Predictors: (Constant), Number of Catalogs Mailed
b. Predictors: (Constant), Number of Catalogs Mailed, Number of Phone Lines Open for Ordering
### Coefficients
#### Model 1
| Coefficients | B | Std. Error | Standardized Coefficients | t | Sig. | 95.0% Confidence Interval for B | Zero-order | Partial | Part | Collinearity Statistics |
|-----------------|-----------|------------|---------------------------|-------|------|----------------------------------|------------|---------|------|-------------------------|
| (Constant) | -14064.614| 2099.365 | | -6.699| .000 | -18221.928, -9907.301 | | | | |
| Number of Catalogs Mailed | 2.991 | .204 | .803 | 14.636| .000 | 2.587, 3.396 | .803 | .803 | .803 | 1.000 |
#### Model 2
| Coefficients | B | Std. Error | Standardized Coefficients | t | Sig. | 95.0% Confidence Interval for B | Zero-order | Partial | Part | Collinearity Statistics |
|-----------------|-----------|------------|---------------------------|-------|------|----------------------------------|------------|---------|------|-------------------------|
| (Constant) | -15361.047| 1705.559 | | -9.006| .000 | -18738
Expert Solution
Step 1

Step by step
Solved in 2 steps with 2 images

Recommended textbooks for you
MATLAB: An Introduction with Applications
Statistics
ISBN:
9781119256830
Author:
Amos Gilat
Publisher:
John Wiley & Sons Inc

Probability and Statistics for Engineering and th…
Statistics
ISBN:
9781305251809
Author:
Jay L. Devore
Publisher:
Cengage Learning

Statistics for The Behavioral Sciences (MindTap C…
Statistics
ISBN:
9781305504912
Author:
Frederick J Gravetter, Larry B. Wallnau
Publisher:
Cengage Learning
MATLAB: An Introduction with Applications
Statistics
ISBN:
9781119256830
Author:
Amos Gilat
Publisher:
John Wiley & Sons Inc
Probability and Statistics for Engineering and th…
Statistics
ISBN:
9781305251809
Author:
Jay L. Devore
Publisher:
Cengage Learning
Statistics for The Behavioral Sciences (MindTap C…
Statistics
ISBN:
9781305504912
Author:
Frederick J Gravetter, Larry B. Wallnau
Publisher:
Cengage Learning

Elementary Statistics: Picturing the World (7th E…
Statistics
ISBN:
9780134683416
Author:
Ron Larson, Betsy Farber
Publisher:
PEARSON

The Basic Practice of Statistics
Statistics
ISBN:
9781319042578
Author:
David S. Moore, William I. Notz, Michael A. Fligner
Publisher:
W. H. Freeman

Introduction to the Practice of Statistics
Statistics
ISBN:
9781319013387
Author:
David S. Moore, George P. McCabe, Bruce A. Craig
Publisher:
W. H. Freeman