Which statements are accurate? Select all that apply. The function represented by the graph is a growth function, and the function represented by the table is a decay function. The function represented by the table is increasing at a greater rate than the function represented by the graph. The two functions have the same horizontal asymptote. The function represented by the table approaches -3 as x increases.
Which statements are accurate? Select all that apply. The function represented by the graph is a growth function, and the function represented by the table is a decay function. The function represented by the table is increasing at a greater rate than the function represented by the graph. The two functions have the same horizontal asymptote. The function represented by the table approaches -3 as x increases.

Advanced Engineering Mathematics
10th Edition
ISBN:9780470458365
Author:Erwin Kreyszig
Publisher:Erwin Kreyszig
Chapter2: Second-order Linear Odes
Section: Chapter Questions
Problem 1RQ

Related questions
Question
![**This graph and table each represent functions.**
**Table:**
\[
\begin{array}{|c|c|}
\hline
x & f(x) \\
\hline
-4 & 13 \\
-3 & 5 \\
-2 & 1 \\
-1 & -1 \\
0 & -2 \\
1 & -2.5 \\
2 & -2.75 \\
3 & -2.875 \\
\hline
\end{array}
\]
**Graph:**
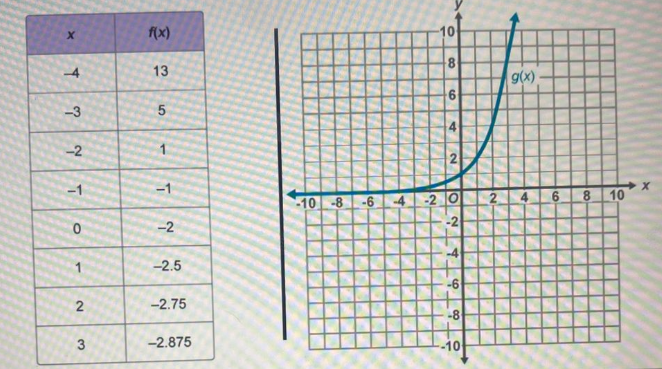
The graph shows a curve labeled \( g(x) \). The curve starts near \( x = -2 \) and \( y = -2 \) and rises rapidly as it moves to the right, passing through \( y = 10 \) when \( x = 3 \). The x-axis ranges from -10 to 10, and the y-axis ranges from -10 to 10 as well.
**Which statements are accurate? Select all that apply.**
- [ ] The function represented by the graph is a growth function, and the function represented by the table is a decay function.
- [ ] The function represented by the table is increasing at a greater rate than the function represented by the graph.
- [ ] The two functions have the same horizontal asymptote.
- [ ] The function represented by the table approaches -3 as \( x \) increases.](/v2/_next/image?url=https%3A%2F%2Fcontent.bartleby.com%2Fqna-images%2Fquestion%2F1c3d4b5b-7c63-4562-84e8-65fa84143989%2Fe3825821-831a-4bc1-97a7-654981285501%2Fmltp01a_processed.jpeg&w=3840&q=75)
Transcribed Image Text:**This graph and table each represent functions.**
**Table:**
\[
\begin{array}{|c|c|}
\hline
x & f(x) \\
\hline
-4 & 13 \\
-3 & 5 \\
-2 & 1 \\
-1 & -1 \\
0 & -2 \\
1 & -2.5 \\
2 & -2.75 \\
3 & -2.875 \\
\hline
\end{array}
\]
**Graph:**
The graph shows a curve labeled \( g(x) \). The curve starts near \( x = -2 \) and \( y = -2 \) and rises rapidly as it moves to the right, passing through \( y = 10 \) when \( x = 3 \). The x-axis ranges from -10 to 10, and the y-axis ranges from -10 to 10 as well.
**Which statements are accurate? Select all that apply.**
- [ ] The function represented by the graph is a growth function, and the function represented by the table is a decay function.
- [ ] The function represented by the table is increasing at a greater rate than the function represented by the graph.
- [ ] The two functions have the same horizontal asymptote.
- [ ] The function represented by the table approaches -3 as \( x \) increases.
Expert Solution
Step 1
- Statement 1: "The function represented by the graph is a growth function, and the function represented by the table is a decay function"
This statement is True because, the function's value represented in the table is decreasing when the value of x is increasing that's makes it a Decay Function and,
the function's value in the graph is increasing with the increasing value of x. Hence, it is a growth function.
- Statement 2: "The function represented by the table is increasing at a greater rate than the function represented by the graph."
This statement is False because, the function represented by the table is a decresing function and other is increasing.

Trending now
This is a popular solution!

Step by step
Solved in 2 steps with 1 images

Recommended textbooks for you
Advanced Engineering Mathematics
Advanced Math
ISBN:
9780470458365
Author:
Erwin Kreyszig
Publisher:
Wiley, John & Sons, Incorporated

Numerical Methods for Engineers
Advanced Math
ISBN:
9780073397924
Author:
Steven C. Chapra Dr., Raymond P. Canale
Publisher:
McGraw-Hill Education

Introductory Mathematics for Engineering Applicat…
Advanced Math
ISBN:
9781118141809
Author:
Nathan Klingbeil
Publisher:
WILEY
Advanced Engineering Mathematics
Advanced Math
ISBN:
9780470458365
Author:
Erwin Kreyszig
Publisher:
Wiley, John & Sons, Incorporated
Numerical Methods for Engineers
Advanced Math
ISBN:
9780073397924
Author:
Steven C. Chapra Dr., Raymond P. Canale
Publisher:
McGraw-Hill Education
Introductory Mathematics for Engineering Applicat…
Advanced Math
ISBN:
9781118141809
Author:
Nathan Klingbeil
Publisher:
WILEY

Mathematics For Machine Technology
Advanced Math
ISBN:
9781337798310
Author:
Peterson, John.
Publisher:
Cengage Learning,

