Where are the deer? Random samples of square kilometer plots were taken in different ecological locations of Mesa Verde National Park. The deer count per square kilometer was recorded and is shown below. Mountain 30, 29, 20, 29 Brush Sagebrush 20, 58, 18, 22 Grassland Pinon 5, 18, 4, 9 Juniper Does the data provide sufficient evidence that there is a difference among the mean deer per square kilometer in these different ecological regions? Use a 5% significance level.


Inverse Normal Distribution
The method used for finding the corresponding z-critical value in a normal distribution using the known probability is said to be an inverse normal distribution. The inverse normal distribution is a continuous probability distribution with a family of two parameters.
Mean, Median, Mode
It is a descriptive summary of a data set. It can be defined by using some of the measures. The central tendencies do not provide information regarding individual data from the dataset. However, they give a summary of the data set. The central tendency or measure of central tendency is a central or typical value for a probability distribution.
Z-Scores
A z-score is a unit of measurement used in statistics to describe the position of a raw score in terms of its distance from the mean, measured with reference to standard deviation from the mean. Z-scores are useful in statistics because they allow comparison between two scores that belong to different normal distributions.
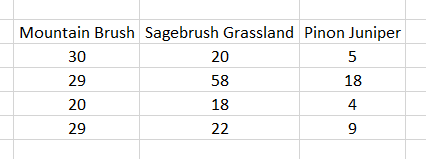
Where are the deer? Random samples of square
kilometer plots were taken in different ecological
locations of Mesa Verde National Park. The deer
count per square kilometer was recorded and is
shown below.
Mountain 30, 29, 20, 29
Brush
Sagebrush 20, 58, 18, 22
Grassland
Pinon 5, 18, 4, 9
Juniper
Does the data provide sufficient evidence that there is
a difference among the mean deer per square
kilometer in these different ecological regions? Use a
5% significance level.
What kind of problem is this and how would it be done using a ti83 calculator
The given problem can be solved using ANOVA test.
Given Information:
The hypothesis problem can be solved using following steps:
Step 1: Formulate hypothesis:
Null Hypothesis (Ho): There is no difference in the mean deer per square
kilometer in these different ecological regions.
Alternate Hypothesis: There is a significant difference in the mean deer per square kilometer in these different ecological regions.

Step by step
Solved in 2 steps with 4 images


