When several processes are taking place at once, how does the capacity analysis respond?


What is a Capacity Analysis?
When a manufacturer needs to increase capacity, they often start with the kneejerk responses above. However, one can only purchase so many machines and schedule so many shifts before the focus on improving capacity moves inward. And the best way to pinpoint where action should be taken to increase capacity is in the data.
The process of capacity analysis is the difference between potential capacity and the actual output a company currently achieves. By collecting production data, manufacturers can identify what process, equipment, or function needs to be changed to increase capacity. This will essentially allow manufacturers to drive greater utilization from their existing resources via process optimization.
How to Perform a Manufacturing Capacity Analysis
Companies that perform a manufacturing capacity analysis are able to reduce downtime and waste. They can also mine the data to optimize processes and streamline workflows. Doing so can help them understand what the existing constraints are and make real-time decisions to solve problems as they happen. As data support these solutions, managers can drive improvement throughout the operation and increase capacity without additional investment in equipment or labor. For companies looking to improve their manufacturing capacity, here are the steps required to unlock existing capacity:
Benchmark Data
If you don’t know where you’re at, you’re not going to see where you’re headed. It’s common to overestimate current equipment utilization as many companies may not even realize that utilization is as low as it is.
Benchmarking includes determining existing capacity. Machine speed, quality losses, downtime by categories – such as breakdowns, changeovers, and performance losses – must all be measured to determine the current capacity. And in many cases, that number is shocking. Several best practices can be used to create a solid and practical framework for benchmarking:
- Internal Meetings: An internal kickoff meeting helps set expectations and ensures that everyone is on the same page. By bringing the right team together, everyone will know what the utilization goal should be.
- Checking the Data: There are times when the current data reported says little about the actual status of the machine. It may be incorrectly recording the status, or it may be part count, downtime, or some other parameter. Making sure the data is true will help in analyzing what needs to be done.
- Evaluating Data: This is where original assumptions are compared with actual current utilization. It represents a new launch point on what improvements can be made.
- Planning: By creating an improvement plan, managers can pull together the pieces of original expectations, the actual data-driven state of capacity, and what improvements can be made.
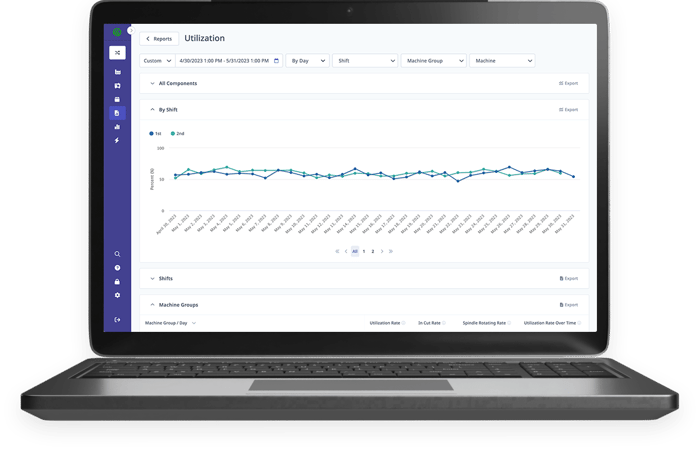
An example of a MachineMetrics utilization report, one of many pre-built reports that can be used for benchmarking data.
Analyze Downtime
Once a manufacturing operation has benchmarked its data and understands its true utilization, a downtime analysis must be conducted. This involves managers, technicians, manufacturing engineers, operators, and others who can help identify all the reasons for downtime and plan how to reduce or eliminate it.
With the revelations that accompanied the benchmarking of the facility, team members can move on to measuring the downtime driving that utilization. By answering how much downtime is occurring and what category the downtime falls under, steps for improvement become more apparent. This is best done by automated machine data collection software to ensure that accurate data is used and standardized and real-time.
The downtime must also categorize the reasons for downtime. Categories to consider may include:
- Planned vs. Unplanned Downtime: Each takes a machine out of service, but they both have quite different approaches to minimizing occurrences and bringing the machine back online.
- Human Error or Operator Action: In a large and complex manufacturing environment, operators may have different levels of training or may perform tasks or actions in an order that reduces efficiency. These can often be spotted and trended through downtime analysis.
- Quality Fallout: Quality is a broad category that must be included in downtime analysis. It may lead to insights on training, machine state, and upkeep, inbound vendor quality, or even ambient conditions within the facility between warmer days and cooler nights.
Once the categories are determined, team members can drill down to determine the reasons for downtime within the category. For example, there may be many types of planned downtime, including scheduled maintenance, seasonal production, and others.
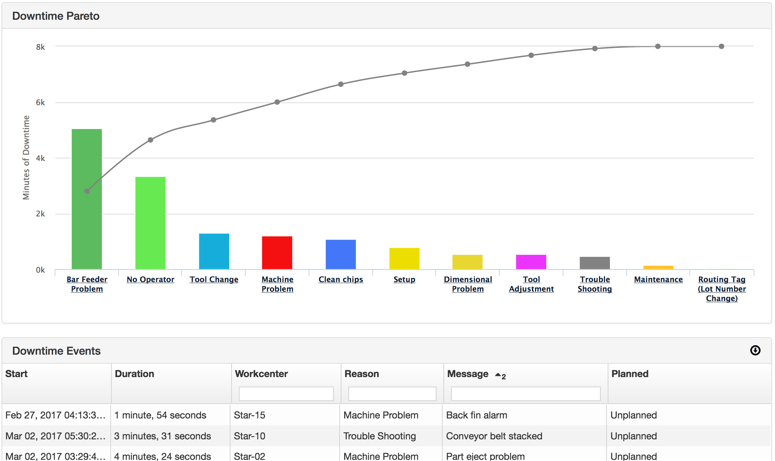
The MachineMetrics Downtime Pareto reveals the most egregious downtime reasons and is a great starting point for finding processes to improve upon.
Likewise, there are countless reasons for unplanned downtime. These can range from material not at the machine when needed to an improperly maintained machine. It may also point to a wrongly designed workflow where material from upstream is not ready when needed, creating a domino effect.
The same is true for human error. Manufacturing operations are becoming more automated, but there is still a need for labor. Fatigue, inadequate training, lack of understanding about the workflow, or broken process steps can mean workers make mistakes they would not otherwise make.
The best way to gather this information is through automation and software. By making the data visualization intuitive and easy to record, operators can utilize a dashboard to enter actual data and see its impact. Just as an operator can enter the reasons for the downtime, tools such as Pareto charts can help understand the downtime analysis as it moves forward. This gives users insights and often helps trigger improvement suggestions.
By the end of the downtime analysis, actual downtime costs and their impact on the bottom line can be determined. This also helps identify the “low hanging fruit,” the quickest and easiest items to fix with the most significant impact on dollars saved and capacity added.

Step by step
Solved in 2 steps with 3 images


