What is σ2σ2 for this data set? Suppose each data value was divided by 5. What is μμ of the resulting data set? What is σσ of the resulting data set? What is σ2σ2 of the resulting data set?
Q: ep 3 of 3: Determine if the data set is unimodal, bimodal, multimodal, or has no mode. Identify the…
A: The data set of size 6 is given.Given that,
Q: Full data setO Uncarpeted 11.3 A researcher wanted to determine if carpeted or uncarpeted rooms…
A: First it is important to test equality of two samples to perform two sample t tests Using excel data…
Q: A sample of blood pressure measurements is taken from a data set and those values (mm Hg) are…
A: Solution The mean for systolic is higer than median Also The mean for Diastolic is higer than median…
Q: When data are collected in a statistical study for only a portion or subset of all elements of…
A: A sample is a part of the population, which is selected from the population and if the sample is…
Q: Find the principal components of the data for Exercise 2. Reference Exercise 2: 5 2 6. 3 11 3 11 6.…
A:
Q: A data set consist of 2,2,3,4,5,5 and 7. Then 20 is added to the data set. The new value will havw…
A: Mean, median, and mode are the three measures of central tendency.
Q: Calculate the average number of visits to Target using the data in
A: W X (Visits) WX 5 6 36 1 7 49 5 8 64
Q: Exhibit 15-3 Pertain to the following data. group1 group2 group3 4 11…
A: Preliminary calculation:Here, number of groups, m is 3Number of samples in each group, n is…
Q: Complete the stemplot for the following data. 83 61 65 63 50 55 68 73 60 53 50 60 50 59 66 83 69…
A: From the above data We are given that. 5# | 00003569 6# | 00113445566789 7# | 03457 8# | 3 3 9
Q: Dlivia works at a company that creates mobile phones. She wanted to estimate the mean amount of tim…
A: Given data,n=6df=n-1=5x=9s=2.07α=0.10t-critical value is tc=2.015
Q: a. The mean and standard deviation for x1 are 6.6 and 3.3, respectively. The mean and standard…
A:
Q: 1. Consider the following sets of data. Which data appears to have more variation? SETA 35 16 22 19…
A: Given Data set are given by Set A 35 16 22 19 23 13 17 27 9 15 Set B 15 9 56 30 3 70 2 40 51…
Q: The data set shown below contains the number of hurricanes that occurred each year over a 14-year…
A: Some scientists claim that there has been a increase in the number of hurricanes as the years…
Q: The population of rabbits in a forest has been recorded every decade since the year 1970. The…
A:
Q: The U.S. Census Bureau needs to estimate the median income of females in the U.S., they collect…
A: To estimate the median income of the females in U.S, income from 3500 females is collected.
Q: Find sd.The differences between two sets of dependent data are 0.4, 0.24, 0.22, 0.26, 0.34. Round…
A: The formula for sample standard deviation is,
Q: You are given the following information about x and y. (Note: copy and paste the data in an Excel…
A: Coefficient of determination is denoted by r2
Q: Find the interquartile range. Round your answer to one decimal place as needed. IQR = %3D
A: Based on the provided information, the following values are known.…
Q: Use the same scales to construct boxplots for the pulse rates of BEE Click the icon to view the data…
A: Box plot for Male's Pulse Rate
Q: nd median for each of the two samples and then compare the two sets of results 114 124 139 104 129…
A: Hi! Thank you for the question, As per the honour code, we are allowed to answer three sub-parts at…
Q: Find the mean, the median, and the mode, if any for the given data. Round noninteger means to the…
A: Measure of central tendency measures the central or average value of a dataset. Measured of…
Q: 11q10 Find the 5 number summary for the data shown 20 24 25 30 33 41 42 44 56 65 76 79 89 92 5…
A:
Q: Do various occupational groups differ in their diets? A British study of this question compared 98…
A: Introduction The sample mean is denoted by x¯ and the sample sd is denoted by s.
Q: Consider the following data: −11,−5,−5,−11,13,−11,−5−11,−5,−5,−11,13,−11,−5 Copy Data Step 3 of…
A: data: −11,−5,−5,−11,13,−11,−5−11,−5,−5,−11,13,−11,−5 minimum = -11 maximum = 13 we have to find…
Q: In the accompanying data table, the entries are for five different years and consist of the weights…
A: The question is about matched pair data.Given :
Q: If a data set produces SSR = 300 and SSE = 200, then the coefficient of determination is
A: SSR = 300 SSE = 200 coefficient of determination(R2) = ? SST = SSE+SSR = 200+300 = 500
Q: Slept less than 8hrs 235 Slept 8hrs or more Failed the exam Passed the exam 180 190 203 a) Find the…
A:
Q: Data was collected for a sample of organic snacks. The amount of sugar (in mg) in each snack is…
A: The answer is the First Option: 3 snacks have about 210 mg. of sugar. Explanation:A histogram is…
Q: Do various occupational groups differ in their diets? A British study of this question compared 98…
A: Given The data is as follows: CL=0.95 Alcohol consumption of conductors: Mean±SE=0.39±0.11
Q: A set of n = 10 pairs of scores has X = 20, Y = 30, and XY = 74. What is the value of SP for these…
A: The provided information is as follows:The total number of observations is .
Q: A data set contains the observations 7,4,2,3,1. Find ( Σx)^2
A:
Q: The data set lowbwt contains information for a sample of 100 low birth weight infants born in two…
A: The output for the least square regression (using Excel) are SUMMARY OUTPUT Regression…
Q: For a data set obtained from a sample, n = 84 andX = 47.05. It is known that o = 3.8. a. What is the…
A:
Q: Student X and Y decided to develop their skill in using the analytical balance. They tried measuring…
A:
Q: During one shift, the express lane clerk recorded how many times customers violated the "10 items or…
A:
Q: Consider the following data. 0,-11,-11,-11, –9, 0,0 Step 2 of 3: Determine the median of the given…
A: Arrange the data values in the ascending order. -11, -11, -11, -9, 0, 0, 0 Here, number of values…
Q: Find the five-number summary for the following set of data. Data 2 7 9 10 12 12 16 17 21 21 25…
A: 2,7,9,10,12,12,16,17,21,21,25
Q: Consider the following data. 0,-11,-11,- 11, -9, 0,0 Step 1 of 3: Determine the mean of the given…
A: Mean: The mean is the sum of observations divided by the number of observations. that is, Mean = x =…
Q: Coefficients Standard Error t Stat P-value Lower 95% Upper 95% Lower 95.0% Upper 95.0% Intercept…
A: we know that there is unit change in dependent variable when there is unit change independent…
Q: A sample of blood pressure measurements is taken from a data set and those values (mm Hg) are listed…
A: The number of observations in systolic blood pressure is 10.
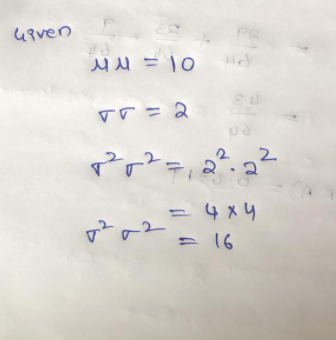
A set of data is found to have a μμ = 10 and a σσ = 2.
What is σ2σ2 for this data set?
Suppose each data value was divided by 5.
What is μμ of the resulting data set?
What is σσ of the resulting data set?
What is σ2σ2 of the resulting data set?
Step by step
Solved in 2 steps with 2 images
- Please help with the following: For the given data, find Σx, n, and ?:A sample of blood pressure measurements is taken from a data set and those values (mm Hg) are listed below. The values are matched so that subjects each have systolic and diastolic measurements. Find the mean and median for each of the two samples and then compare the two sets of results. Are the measures of center the best statistics to use with these data? What else might be better? Systolic: 147 137 146 148 105 102 129 122 95 99 Diastolic: 86 79 68 60 77 82 89 84 72 58A sample of 250 employees of a company is selected, and the average age is found to be 35 years. This value is a statistic or parameter.
- A high school teacher at a small private school assigns trigonometry practice problems to be worked on via the net. Students must use a password to access the problems, and the time of log-in and log-off is automatically recorded for the teacher. At the end of the week, the teacher examines the amount of time each student spent working on the assigned problems. The data is provided below in minutes. Determine Mean, Median and Mode. 15 28 25 48 22 43 49 34 22 33 27 25 22 20 39A sample of blood pressure measurements is taken from a data set and those values (mm Hg) are listed below. The values are matched so that subjects each have systolic and diastolic measurements. Find the mean and median for each of the two samples and then compare the two sets of results. Are the measures of center the best statistics to use with these data? What else might be better? Systolic: 97 96 134 112 154 116 156 99 153 117 Diastolic: 63 55 87 73 76 88 85 79 69 62 Find the means. The mean for systolic is nothing mm Hg and the mean for diastolic is nothing mm Hg. (Type integers or decimals rounded to one decimal place as needed.) Find the medians. The median for systolic is nothing mm Hg and the median for diastolic is nothing mm Hg. (Type integers or decimals rounded to one decimal place as needed.) Compare the results. Choose the correct answer below. A. The median is lower for the…The data below represent the number of streaming hours listened to per day by a sample of 9 people. Find
- A histogram titled "20 Busiest North American Airports" has a horizontal axis labeled "Total Passengers (Millions)" and a vertical axis labeled "Frequency" with values from 0 to 10. The histogram has 8 bars. Each bar is associated with a label and an approximate value as listed below. Frequency 10 O 0 7 02 8 3 30-39.9 20 Busiest North American Airports 40-49.9 50-59.9 Total Passengers (Millions) What is the lowest frequency value? 60-69.9 70-79.9 80-89.9 90-99.9 100-109.9Identify the following distribution as binomial, geometric or neither.A headache remedy is said to be 80% effective in curing headaches caused by simple nervous tension. An investigator tests this remedy on 100 randomly selected patients suffering from nervous tension and counts how many have had headache relief after taking the drug.a) Binomialb) Geometricc) NeitherThe data set shown below contains the number of hurricanes that occurred each year over a 14-year period. Some scientists claim that there has been an increase in the number of hurricanes as the years progressed. Complete parts (a) through (d). Year 10 11 12 13 140 # 3 4. 2 1 a) Create a histogram of these data. Choose the correct histogram below. OA. OB. Oc. OD. # of Hurricanes # of Hurricanes # of Hurricanes # of Hurricanes b) Describe the distribution. Is the distribution uniform, unimodal, or bimodal? O A. The distribution is uniform. O B. The distribution is bimodal. O C. The distribution is unimodal. Is the distribution symmetric or skewed?
- 1:15 (a) Which variable is the explanatory variable? OA. One of the biggest factors in determining the value of a home is the square footage. The accompanying data represent the square footage and selling price (in thousands of dollars) for a random sample of homes for sale in a certain region. Complete parts (a) through (h) below. Click the icon to view the housing data. Square Footage Selling Price (b) Draw a scatter diagram of the data. Choose the correct scatter diagram below. Ay 4500- 000 1000 mylab.pearson.com/ + ® : 3 4500 Data Table Q Square Footage, x 2148 3231 1177 1988 3064 2735 4146 2215 2625 1629 1773 3887 Print ||| OB. r= 0.899 (Round to three decimal places as needed.) = AX 4500- 1000+++ 150 750 Q (c) Determine the linear correlation coefficient between square footage and asking price. Done Ay 750- Vo) 1 LTE2 150- O 1000 Selling Price ($000s), y D 371.1 382.2 197.6 339.9 614.9 364.7 632.7 377.7 427.5 285.9 268.9 701.4 4500 .... .... Q X D. Ay 750- 41% 150+ 1000 4500Suppose you read a research article that reported the results of a chi square analysis examining the relationship between treatment success (attributes = “yes” or “no”) and history of substance abuse (attributes = “yes” or “no”). The article included the following results in the note on the contingency table: X2 = 3.376, df = 1, p = .015. Which of the following are accurate interpretations of these results? (SELECT TWO CORRECT ANSWERS) Group of answer choices The association between treatment success and history of substance use is NOT statistically significant We can reject the null hypothesis The association between treatment success and history of substance use is statistically significant We can accept the null hypothesis