What is the predicted cost of maintenance for someone who racks up about 2,000 miles per month on a sedan? c. Suppose one of the observations used to get the data table above was a sedan owner who reported he drove 980 miles this month and spent about $450 on maintenance costs in the same month. What is the residual of this observation?
Correlation
Correlation defines a relationship between two independent variables. It tells the degree to which variables move in relation to each other. When two sets of data are related to each other, there is a correlation between them.
Linear Correlation
A correlation is used to determine the relationships between numerical and categorical variables. In other words, it is an indicator of how things are connected to one another. The correlation analysis is the study of how variables are related.
Regression Analysis
Regression analysis is a statistical method in which it estimates the relationship between a dependent variable and one or more independent variable. In simple terms dependent variable is called as outcome variable and independent variable is called as predictors. Regression analysis is one of the methods to find the trends in data. The independent variable used in Regression analysis is named Predictor variable. It offers data of an associated dependent variable regarding a particular outcome.
please use chart attatched.
a. Explain the meaning of the slope of the regression line in this context.
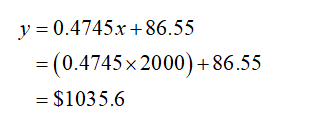
b. What is the predicted cost of maintenance for someone who racks up about 2,000 miles per month on a sedan?
c. Suppose one of the observations used to get the data table above was a sedan owner who reported he drove 980 miles this month and spent about $450 on maintenance costs in the same month. What is the residual of this observation?

a.
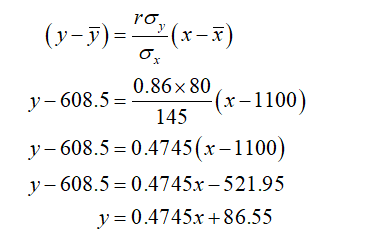
The regression equation is obtained below:
Let us define y as the maintenance cost and x as the number of miles driven on a sedan.

Regression Equation is y-hat=b0+b1x
Interpretation:
Intercept, b0: Represents the percentage of constant change in y.
Slope, b1: The variable y increases(decreases) by b1 units with each unit increase in the variable x.
From the regression equation, the slope value is 0.4745.
Interpretation:
Slope, b1: The slope value is 0.4745 and it is positive. It can be interpreted that the maintenance cost is expected to increase by $0.4745 dollars if the number of miles driven on a Sedan is increases by 1 mile.
b.
Given that the number of miles driven is 2,000 miles.
Substitute x=2000 in regression equation

Step by step
Solved in 3 steps with 4 images


