4. Determine FLEV and Spread and the noncontrolling interest ratio (if applicable). Show that: [RNOA + (FLEV x Spread)] x Noncontrolling interest ratio ROE Compare the components of the equation for each company over time and follow up on any differences. A В D Consolidated Balance Sheet USD ($) $ in Millions Dec. 31, 2018 1 increase or decrease % Current assets 2 $ 3,042 Cash and cash equivalents 3 0.88% Notes and accounts receivable, less estimated doubtful amounts 24,701 4 7.13% Inventories 5 Crude oil, products and merchandise 14,803 6 4.28% Materials and supplies 4,155 7 1.20% Other current assets 1,272 0.37% Total current assets Investments, advances and long-term receivables 40,790 10 11.78% Property, plant and equipment, at cost, less accumulated depreciation and depletion 247,101 11 71.38% 10,332 Other assets, including intangibles, net 12 2.98% Total assets 346,196 13 100.00% Current liabilities 14 Notes and loans payable 17,258 15 4.99% Accounts payable and accrued liabilities 37,268 16 10.77% Income taxes payable 2,612 17 0.75% Total current liabilities 18 Long-term debt 20,538 19 5.93% Postretirement benefits reserves 20,272 20 5.86% Deferred income tax liabilities 27,244 21 7.87% Long-term obligations to equity companies 4,382 22 1.27% Other long-term obligations 18,094 23 5.23% Total liabilities 147,668 24 42.65% Commitments and contingencies 25 Equity 26 Common stock without par value (9,000 million shares authorized, 8,019 million shares issued) 15,258 27 4.41% Earnings reinvested 421,653 28 121.80% Accumulated other comprehensive income (19,564) 29 -5.65% (225,553) Common stock held in treasury (3,782 million shares in 2018 and 3,780 million shares in 2017) 30 -65.15% ExxonMobil share of equity 31 Noncontrolling interests 6,734 32 1.95% Total equity 198,528 33 57.35% $ 346,196 Total liabilities and equity 34 100.00% 35 36
4. Determine FLEV and Spread and the noncontrolling interest ratio (if applicable). Show that: [RNOA + (FLEV x Spread)] x Noncontrolling interest ratio ROE Compare the components of the equation for each company over time and follow up on any differences. A В D Consolidated Balance Sheet USD ($) $ in Millions Dec. 31, 2018 1 increase or decrease % Current assets 2 $ 3,042 Cash and cash equivalents 3 0.88% Notes and accounts receivable, less estimated doubtful amounts 24,701 4 7.13% Inventories 5 Crude oil, products and merchandise 14,803 6 4.28% Materials and supplies 4,155 7 1.20% Other current assets 1,272 0.37% Total current assets Investments, advances and long-term receivables 40,790 10 11.78% Property, plant and equipment, at cost, less accumulated depreciation and depletion 247,101 11 71.38% 10,332 Other assets, including intangibles, net 12 2.98% Total assets 346,196 13 100.00% Current liabilities 14 Notes and loans payable 17,258 15 4.99% Accounts payable and accrued liabilities 37,268 16 10.77% Income taxes payable 2,612 17 0.75% Total current liabilities 18 Long-term debt 20,538 19 5.93% Postretirement benefits reserves 20,272 20 5.86% Deferred income tax liabilities 27,244 21 7.87% Long-term obligations to equity companies 4,382 22 1.27% Other long-term obligations 18,094 23 5.23% Total liabilities 147,668 24 42.65% Commitments and contingencies 25 Equity 26 Common stock without par value (9,000 million shares authorized, 8,019 million shares issued) 15,258 27 4.41% Earnings reinvested 421,653 28 121.80% Accumulated other comprehensive income (19,564) 29 -5.65% (225,553) Common stock held in treasury (3,782 million shares in 2018 and 3,780 million shares in 2017) 30 -65.15% ExxonMobil share of equity 31 Noncontrolling interests 6,734 32 1.95% Total equity 198,528 33 57.35% $ 346,196 Total liabilities and equity 34 100.00% 35 36
Chapter1: Financial Statements And Business Decisions
Section: Chapter Questions
Problem 1Q
Related questions
Question
Determine flev and spread and the non controling interest ratio(in aplicable)
show:
ROE=[ROA+(FLEV X SPREAD)] X noncontroling interest ratio
![4. Determine FLEV and Spread and the noncontrolling interest ratio (if applicable). Show that:
[RNOA + (FLEV x Spread)] x Noncontrolling interest ratio
ROE
Compare the components of the equation for each company over time and follow up on any differences.](/v2/_next/image?url=https%3A%2F%2Fcontent.bartleby.com%2Fqna-images%2Fquestion%2F5940f3c3-1c7c-4301-8644-2d7171692061%2F6f8c0cf8-f4fb-47f3-8120-17b9bd29a20e%2Ftqn4wqk.jpeg&w=3840&q=75)
Transcribed Image Text:4. Determine FLEV and Spread and the noncontrolling interest ratio (if applicable). Show that:
[RNOA + (FLEV x Spread)] x Noncontrolling interest ratio
ROE
Compare the components of the equation for each company over time and follow up on any differences.

Transcribed Image Text:A
В
D
Consolidated Balance Sheet USD ($) $ in Millions
Dec. 31, 2018
1
increase or decrease %
Current assets
2
$ 3,042
Cash and cash equivalents
3
0.88%
Notes and accounts receivable, less estimated doubtful amounts
24,701
4
7.13%
Inventories
5
Crude oil, products and merchandise
14,803
6
4.28%
Materials and supplies
4,155
7
1.20%
Other current assets
1,272
0.37%
Total current assets
Investments, advances and long-term receivables
40,790
10
11.78%
Property, plant and equipment, at cost, less accumulated depreciation and depletion
247,101
11
71.38%
10,332
Other assets, including intangibles, net
12
2.98%
Total assets
346,196
13
100.00%
Current liabilities
14
Notes and loans payable
17,258
15
4.99%
Accounts payable and accrued liabilities
37,268
16
10.77%
Income taxes payable
2,612
17
0.75%
Total current liabilities
18
Long-term debt
20,538
19
5.93%
Postretirement benefits reserves
20,272
20
5.86%
Deferred income tax liabilities
27,244
21
7.87%
Long-term obligations to equity companies
4,382
22
1.27%
Other long-term obligations
18,094
23
5.23%
Total liabilities
147,668
24
42.65%
Commitments and contingencies
25
Equity
26
Common stock without par value (9,000 million shares authorized, 8,019 million shares issued)
15,258
27
4.41%
Earnings reinvested
421,653
28
121.80%
Accumulated other comprehensive income
(19,564)
29
-5.65%
(225,553)
Common stock held in treasury (3,782 million shares in 2018 and 3,780 million shares in 2017)
30
-65.15%
ExxonMobil share of equity
31
Noncontrolling interests
6,734
32
1.95%
Total equity
198,528
33
57.35%
$ 346,196
Total liabilities and equity
34
100.00%
35
36
Expert Solution
This question has been solved!
Explore an expertly crafted, step-by-step solution for a thorough understanding of key concepts.
This is a popular solution!
Trending now
This is a popular solution!
Step by step
Solved in 2 steps with 1 images

Follow-up Questions
Read through expert solutions to related follow-up questions below.
Follow-up Question
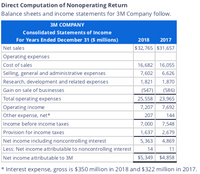
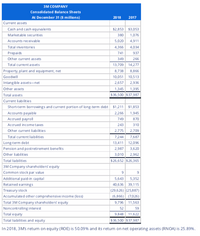
RNOA + FLEV X Spread X NCI Ratio = ROE
25.89% +FLEV X 24.37% X 1.0026 =50%
What is FLEV? Please show steps

Transcribed Image Text:Direct Computation of Nonoperating Return
Balance sheets and income statements for 3M Company follow.
зм СOMPANY
Consolidated Statements of Income
For Years Ended December 31 ($ millions)
2018
2017
Net sales
$32,765 $31,657
Operating expenses
Cost of sales
16,682 16,055
Selling, general and administrative expenses
7,602
6,626
Research, development and related expenses
1,821
1,870
Gain on sale of bus inesses
(586)
25,558 23,965
(547)
Total operating expenses
Operating income
7,207
7,692
Other expense, net*
207
144
Income before income taxes
7,000
7,548
Provision for income taxes
1,637
2,679
Net income including noncontrolling interest
5,363 4,869
Less: Net income attributable to noncontrolling interest
14
11
Net income attributable to 3M
$5,349 $4,858
* Interest expense, gross is $350 million in 2018 and $322 million in 2017.

Transcribed Image Text:зм СOMPANY
Consolidated Balance Sheets
At December 31 ($ millions)
2018
2017
Current assets
Cash and cash equivalents
$2,853 $3,053
380
Marketable securities
1,076
Accounts receivable
5,020
4,911
Total inventories
4,366
4,034
Prepaids
741
937
Other current assets
349
266
Total current assets
13,709 14,277
Property, plant and equipment, net
8,738
8,866
Goodwill
10,051 10,513
Intangible assets-net
2,657
2,936
Other assets
1,345
1,395
Total assets
$36,500 $37,987
Current liabilities
Short-term borrowings and current portion of long-term debt
$1,211 $1,853
Accounts payable
2,266
1,945
Accrued payroll
749
870
Accrued income taxes
243
310
Other current li abilities
2,775
2,709
Total current liabilities
7,244
7,687
Long-term debt
13,411 12,096
Pension and postretirement benefits
2,987
3,620
Other liabilities
3,010
2,962
Total liabilities
$26,652 $26,365
3M Company shareholders equity
Common stock par value
9.
Additional paid-in capital
Retained earnings
Treasury stock
Accumulated other comprehensive income (loss)
5,643
5,352
40,636 39,115
(29,626) (25,887)
(6,866) (7,026)
9,796 11,563
Total 3M Company shareholders equity
Noncontralling interest
52
59
Total equity
9,848 11,622
Total liabilities and equity
$36,500 $37,987
In 2018, 3M's return on equity (ROE) is 50.09% and its return on net operating assets (RNOA) is 25.89%.
Solution
Knowledge Booster
Learn more about
Need a deep-dive on the concept behind this application? Look no further. Learn more about this topic, accounting and related others by exploring similar questions and additional content below.Recommended textbooks for you


Accounting
Accounting
ISBN:
9781337272094
Author:
WARREN, Carl S., Reeve, James M., Duchac, Jonathan E.
Publisher:
Cengage Learning,

Accounting Information Systems
Accounting
ISBN:
9781337619202
Author:
Hall, James A.
Publisher:
Cengage Learning,


Accounting
Accounting
ISBN:
9781337272094
Author:
WARREN, Carl S., Reeve, James M., Duchac, Jonathan E.
Publisher:
Cengage Learning,

Accounting Information Systems
Accounting
ISBN:
9781337619202
Author:
Hall, James A.
Publisher:
Cengage Learning,

Horngren's Cost Accounting: A Managerial Emphasis…
Accounting
ISBN:
9780134475585
Author:
Srikant M. Datar, Madhav V. Rajan
Publisher:
PEARSON

Intermediate Accounting
Accounting
ISBN:
9781259722660
Author:
J. David Spiceland, Mark W. Nelson, Wayne M Thomas
Publisher:
McGraw-Hill Education

Financial and Managerial Accounting
Accounting
ISBN:
9781259726705
Author:
John J Wild, Ken W. Shaw, Barbara Chiappetta Fundamental Accounting Principles
Publisher:
McGraw-Hill Education