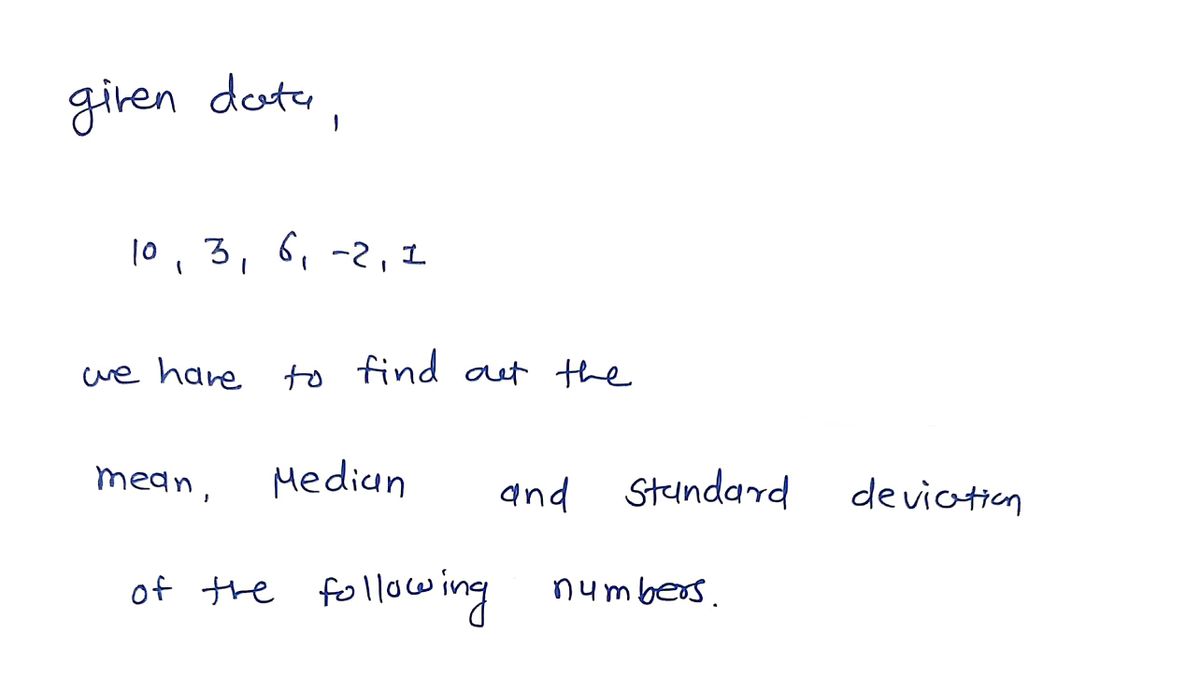
What are the mean, median, and sample standard deviation of the following numbers? 10 3 6 -2 1
Q: The numbers of regular season wins for 10 football teams in a given season are given below.…
A: n the realm of football analysis, understanding team performance metrics is vital for assessing…
Q: Using the data set provided, calculate the variance and standard deviation, show your calculation…
A: The objective of this question is to calculate the variance and standard deviation of the given data…
Q: The ages (in years) of a random sample of shoppers at a gaming store are shown. Determine the…
A:
Q: The numbers of regular season wins for 10 football teams in a given season are given below.…
A: From the provided information, The data values are as follow: 2, 7, 15, 2, 14, 6, 13, 6, 5, 9…
Q: Listed below are the top 10 salaries (in millions of dollars) of TV personalities.Find the…
A: (i)Range=Maximum value-Minimum value=40-13=27
Q: Calculate the range, variance, and standard deviation for the following sample (Show your work).…
A: 100, 3, 1, 30, 80, 30, 46, 6
Q: The numbers of regular season wins for 10 football teams in a given season are given belc Determine…
A:
Q: find mean and standard deviation of sample. 11,15,25,27,30,32,35,38,42,45,50
A:
Q: The average daily points for my fantasy baseball team are {4.1, 5.7, 3.8, 4.7, 4.7, 5.5, 4.1, 2.7,…
A: Solution: Note: Hello! As you have posted more than 3 sub parts, we are answering the first 3…
Q: What is the sample standard deviation of the number of texts sent? Number of texts sent, x 30 35…
A: The mean of the number of texts sent is,…
Q: find the range, mean, variance, and standard deviation of the sample data set.
A:
Q: Using the data set provided, calculate the variance and standard deviation, show your calculation…
A: The objective of this question is to calculate the variance and standard deviation of the given data…
Q: Calculate the sample standard deviation of the data shown. Round to two 17 22 25 15 19 13 24 sample…
A:
Q: Using the data set provided, calculate the variance and standard deviation, show your calculation…
A: The objective of this question is to calculate the variance and standard deviation of the given data…
Q: How do you calculate the mean and standard deviation of the sampling distribution for sample means?…
A: The probability distribution of the means of large samples is said to be approximately normally…
Q: Calculate Median, Q1, Q3 and IQR, sample mean, sample variance, and sample standard deviation for…
A: Given: data 48, 92, 47, 44, 94, 18, 95, 67, 74, 64
Q: In the diagram below, what is the value of the standard deviation? What is the mean? 4.0 4.5 5.0 5.5…
A:
Q: The numbers of regular season wins for 10 football teams in a given season are given below.…
A: In this context, the given observations are: 2, 10, 15, 2,13, 10, 15, 7, 2, 6. Range: The range is…
Q: days in Buffalo, NY: {17, 26, 3, 13, 29, 34, 32, 30, 41} Which of the following values represent the…
A: Given data, 17,26,3,13,29,34,32,30,41 Standard deviation=? Variance =?
Q: 1. make a survey report of the number of students per section from grades 7-9 2. create a sampling…
A: The sampling distribution is the distribution of the means of the samples. The mean of the sampling…
Q: Here are the foot lengths (in centimeters) for a random sample of 7 fourteen-year-olds from the…
A: Here, data is 25,22,20,25,24,24,28.
Q: Using the data set provided, calculate the variance and standard deviation, show your calculation…
A: The objective of this question is to calculate the variance and standard deviation of the given data…
Q: The numbers of regular season wins for 10 football teams in a given season are given below.…
A: A data population is given as 2, 10, 15, 5, 12, 9, 13, 6, 3 and 8. The minimum value is 2 and the…
Q: What is the percentile rank for a student who scored 74 on a softball rules test if the class mean…
A:
Q: The numbers of regular season wins for 10 football teams in a given season are given below.…
A:
Q: Given the data set below, calculate the range, mean, sample variance, and sample standard deviation.…
A: Given thatData values : 25 , 35 , 19 , 38 , 16 , 16 , 8 , 29 , 47Sum of data values = 233Number of…
Q: What is the standard deviation of the following sample data? 38,27,39,29,41,42
A:
Q: Find the range, the standard deviation, and the variance for the given samples. Round non-integer…
A:
Q: 110, 115, 112, 127, 112, 130.
A: Given that Sample data : 110,115,112,127,112,130 Sum of the data values (∑(Xi)) =…
Q: Using the data set provided, calculate the variance and standard deviation, show your calculation…
A: The objective of this question is to calculate the variance and standard deviation of the given data…
Q: Using the dotplot of % Bachelor's Degree below, determine the range, IQR, variance and standard…
A: Given dot plot is Data from the dot plot is,19,20,24,25,27,27,28,29,29,32,32,33,35,36,49Arrange the…
Q: Using the following sample data, calculate the mean, variance, and standard deviation. 225 325 275…
A: Ans#- Given the following data 225, 325, 275, 250, 375
Q: Provide an appropriate response. Find the sample standard deviation. 26 15 9 11 22 1 4 8 19
A: Solution: n= 10 observation x x2 2 4 6 36 15 225 9 81 11 121 22 484 1 1 4 16…
Q: Price of 9 2-year old Chevy Cobalts in the LA area. 14050 8998 13999 7889 12999 7200 10995 5500…
A: Sample mean:
Q: The numbers of regular season wins for 10 football teams in a given season are given below.…
A:
Q: Find the mean, standard deviation, and variance, given the following sample data. (Round your…
A: 1 The mean is,
Q: what is the mean median and mode? 12, 9, 17, 15, 10
A:
Q: Find the sample variance and standard deviation. 4, 47, 14, 48, 32, 22, 34, 28, 27, 32
A: Given,4, 47, 14, 48, 32, 22, 34, 28, 27, 32 sample size(n)=10sample…
Q: 1. In a sentence or two, explain what a sampling distribution is. 2. In a sentence or two explain…
A: Introduction: The concept of standard error of the mean is relevant in the context of the sampling…
Trending now
This is a popular solution!
Step by step
Solved in 3 steps with 3 images
- Find the standard deviation of the sample data below: 3,5,6,9 (Answer: 1 decimal place) Type your answer... PreviousI need help with this one please thank you!The ages for a sample of fans at a concert are listed. Whats the mean, median, mode, range, variance, standard deviation, and coefficient of variation?
- DESCRIPTIVE STATISTICS: The scores of a test for an engincering class of 10 students is shown here. Scores: 57, 94, 81, 77, 66, 97, 62, 86, 77,87 Consider ungrouped data: What is the mean, median. mode. variance and standard deviation?Find the sample standard deviation. 2, 6, 15, 9, 11, 22, 1, 4, 8, 19 Send data to Excel O 2.1 0 7.1 0 6.8 ContinueFind the sample variance and standard deviation. 7, 57, 14, 50, 32, 23, 30, 27, 26, 26 O
- The numbers of regular season wins for 10 football teams in a given season are given below. Determine the range, mean, variance, and standard deviation of the population data set. 2, 10, 15, 4, 14, 10, 12, 10, 3, 9Use the following set of numbers (6, 2, 4, 2, 8, 3, 10, 10, 2, 4) to determine the sum of squares , sample standard deviation , and population standard deviation .The numbers of regular season wins for 10 football teams in a given season are given below. Determine the range, mean, variance, and standard deviation of the population data set. 2, 9, 15, 4, 15, 6, 12, 8, 5, 9 C The range is 13 (Simplify your answer.) The population mean is 8.5. (Simplify your answer. Round to the nearest tenth as needed.) The population variance is 17.9. (Simplify your answer. Round to the nearest tenth as needed.) The population standard deviation is. (Simplify your answer. Round to the nearest tenth as needed.)
- 22 Michael took 12 tests in his math class. His lowest test score was 78. His highest test score was 98. On the 13th test, he earned a 64. Select whether the value of each statistic for his test scores increased, decreased, or could not be determined when the last test score was added. Standard Deviation Median Mean Increased Decreased Could Not Be Determined acer % & 8he numbers of regular season wins for 10 football teams in a given season are given below. Determine the range, mean, variance, and standard deviation of the opulation data set. 2,7, 15, 4, 14, 6, 13, 8, 3, 10Find the sample variance and standard deviation. 6, 47, 11, 49, 38, 22, 31, 31, 31, 27