What are the hypotheses? ΟΑ H0: με 1000 hic H;:µ< 1000 hic B. Ho: H= 1000 hic H,: µ2 1000 hic Oc. Ho: H> 1000 hic H;:µ< 1000 hic O D. Ho: H< 1000 hic H1: u2 1000 hic Identify the test statistic. t=| | (Round to three decimal places as needed.) Identify the P-value. The P-value is (Round to four decimal places as needed.) State the final conclusion that addresses the original claim. Ho. There is evidence to support the claim that the sample is from a population with a mean less than 1000 hic. What do the results suggest about the child booster seats meeting the specified requirement? O A. The requirement is met since most sample measurements are less than 1000 hic. O B. There is strong evidence that the mean is less than 1000 hic, but one of the booster seats has a measurement that is greater than 1000 hic. OC. The results are inconclusive regarding whether one of the booster seats could have a measurement that is greater than 1000 hic. D. There is not strong evidence that the mean is less than 1000 hic, and one of the booster seats has a measurement that is greater than 1000 hic.
What are the hypotheses? ΟΑ H0: με 1000 hic H;:µ< 1000 hic B. Ho: H= 1000 hic H,: µ2 1000 hic Oc. Ho: H> 1000 hic H;:µ< 1000 hic O D. Ho: H< 1000 hic H1: u2 1000 hic Identify the test statistic. t=| | (Round to three decimal places as needed.) Identify the P-value. The P-value is (Round to four decimal places as needed.) State the final conclusion that addresses the original claim. Ho. There is evidence to support the claim that the sample is from a population with a mean less than 1000 hic. What do the results suggest about the child booster seats meeting the specified requirement? O A. The requirement is met since most sample measurements are less than 1000 hic. O B. There is strong evidence that the mean is less than 1000 hic, but one of the booster seats has a measurement that is greater than 1000 hic. OC. The results are inconclusive regarding whether one of the booster seats could have a measurement that is greater than 1000 hic. D. There is not strong evidence that the mean is less than 1000 hic, and one of the booster seats has a measurement that is greater than 1000 hic.

MATLAB: An Introduction with Applications
6th Edition
ISBN:9781119256830
Author:Amos Gilat
Publisher:Amos Gilat
Chapter1: Starting With Matlab
Section: Chapter Questions
Problem 1P

Related questions
Question
100%
Please help me find the following.
Drop down answers are ( reject/fail to reject) and (insufficient/sufficient)

Transcribed Image Text:What are the hypotheses?
ΟΑ H0: με 1000 hic
H;:µ< 1000 hic
B. Ho: H= 1000 hic
H,: µ2 1000 hic
Oc. Ho: H> 1000 hic
H;:µ< 1000 hic
O D. Ho: H< 1000 hic
H1: u2 1000 hic
Identify the test statistic.
t=|
| (Round to three decimal places as needed.)
Identify the P-value.
The P-value is
(Round to four decimal places as needed.)
State the final conclusion that addresses the original claim.
Ho. There is
evidence to support the claim that the sample is from a population with a mean less than 1000 hic.
What do the results suggest about the child booster seats meeting the specified requirement?
O A. The requirement is met since most sample measurements are less than 1000 hic.
O B. There is strong evidence that the mean is less than 1000 hic, but one of the booster seats has a measurement that is greater than 1000 hic.
OC. The results are inconclusive regarding whether one of the booster seats could have a measurement that is greater than 1000 hic.
D. There is not strong evidence that the mean is less than 1000 hic, and one of the booster seats has a measurement that is greater than 1000 hic.
Expert Solution
Step 1
The descriptive statistics for measurements is conducted using EXCEL. The software procedure is given below:
- Enter the data.
- Select Data > Data Analysis >Descriptive Statistics> OK.
- Enter Input Range as Measurement column.
- Mark Labels in First Row.
- Mark Summary Statistics.
- Click OK.
The output using EXCEL is as follows:
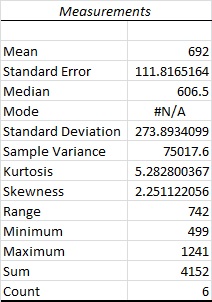
From the Excel output, the mean is 692, and the standard deviation is 273.8934.
Let denotes the population mean.
The claim of the test is the sample is from a population with a mean less than 1,000 hic. The hypothesis is,
Null hypothesis:
Alternative hypothesis:
Correct Answer: Option A.
The test statistic is,
Thus, the test statistic is 2.755.

Trending now
This is a popular solution!

Step by step
Solved in 2 steps with 1 images

Knowledge Booster


Learn more about
Need a deep-dive on the concept behind this application? Look no further. Learn more about this topic, statistics and related others by exploring similar questions and additional content below.Recommended textbooks for you
MATLAB: An Introduction with Applications
Statistics
ISBN:
9781119256830
Author:
Amos Gilat
Publisher:
John Wiley & Sons Inc

Probability and Statistics for Engineering and th…
Statistics
ISBN:
9781305251809
Author:
Jay L. Devore
Publisher:
Cengage Learning

Statistics for The Behavioral Sciences (MindTap C…
Statistics
ISBN:
9781305504912
Author:
Frederick J Gravetter, Larry B. Wallnau
Publisher:
Cengage Learning
MATLAB: An Introduction with Applications
Statistics
ISBN:
9781119256830
Author:
Amos Gilat
Publisher:
John Wiley & Sons Inc
Probability and Statistics for Engineering and th…
Statistics
ISBN:
9781305251809
Author:
Jay L. Devore
Publisher:
Cengage Learning
Statistics for The Behavioral Sciences (MindTap C…
Statistics
ISBN:
9781305504912
Author:
Frederick J Gravetter, Larry B. Wallnau
Publisher:
Cengage Learning

Elementary Statistics: Picturing the World (7th E…
Statistics
ISBN:
9780134683416
Author:
Ron Larson, Betsy Farber
Publisher:
PEARSON

The Basic Practice of Statistics
Statistics
ISBN:
9781319042578
Author:
David S. Moore, William I. Notz, Michael A. Fligner
Publisher:
W. H. Freeman

Introduction to the Practice of Statistics
Statistics
ISBN:
9781319013387
Author:
David S. Moore, George P. McCabe, Bruce A. Craig
Publisher:
W. H. Freeman