What are the 5 assumptions of the Classical Linear Regression Model? List them and Explain 3 of them please. Thanks.


Correlation
Correlation defines a relationship between two independent variables. It tells the degree to which variables move in relation to each other. When two sets of data are related to each other, there is a correlation between them.
Linear Correlation
A correlation is used to determine the relationships between numerical and categorical variables. In other words, it is an indicator of how things are connected to one another. The correlation analysis is the study of how variables are related.
Regression Analysis
Regression analysis is a statistical method in which it estimates the relationship between a dependent variable and one or more independent variable. In simple terms dependent variable is called as outcome variable and independent variable is called as predictors. Regression analysis is one of the methods to find the trends in data. The independent variable used in Regression analysis is named Predictor variable. It offers data of an associated dependent variable regarding a particular outcome.
What are the 5 assumptions of the Classical Linear Regression Model? List them and Explain 3 of them please. Thanks.
Assumptions of the Classical Linear Regression Model:
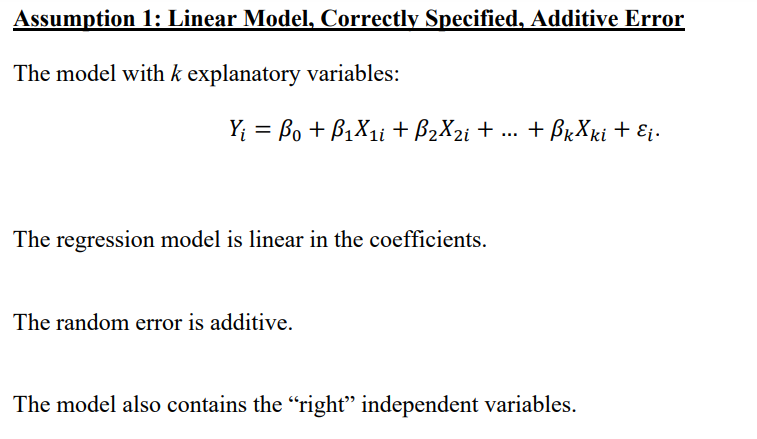
1. The regression model is linear, correctly specified, and has an additive error term.
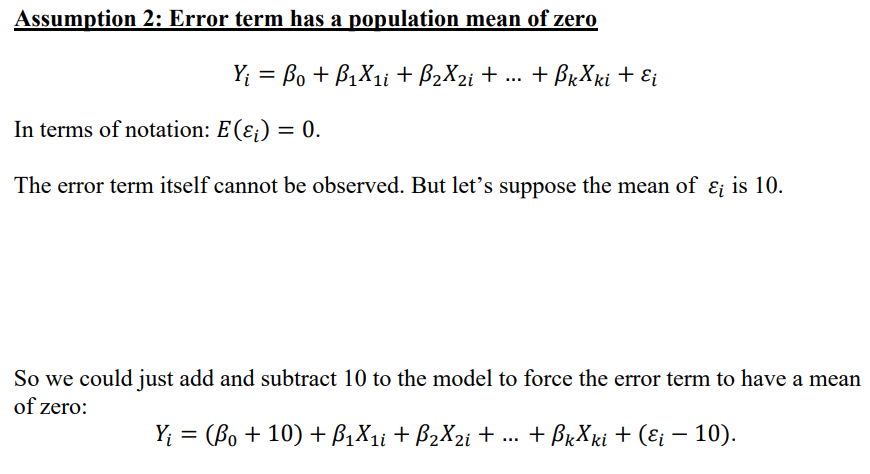
2. The error term has a zero population mean.
3. All explanatory variables are uncorrelated with the error term
4. Observations of the error term are uncorrelated with each other (no serial
correlation).
5. The error term has a constant variance (no heteroskedasticity).
6. No explanatory variable is a perfect linear function of any other explanatory
variables (no perfect multicollinearity).
7. The error term is normally distributed (not required).
Essentially, the rest of the course deals with what happens when one or more of these
assumptions do not hold and what we can do to remedy the situation.

Step by step
Solved in 5 steps with 4 images


