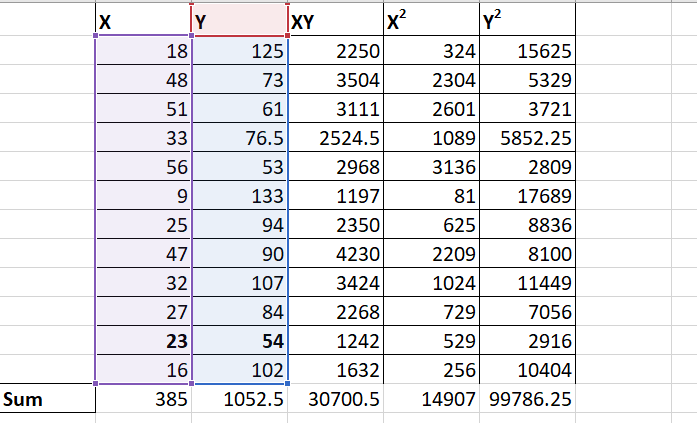
Weeks on Market Selling Price (in thousands of $) 18 125 48 73 51 61 33 76.5 56 53 9. 133 25 94 47 90 32 107 27 84 23 54 16 102
Weeks on Market Selling Price (in thousands of $) 18 125 48 73 51 61 33 76.5 56 53 9. 133 25 94 47 90 32 107 27 84 23 54 16 102

MATLAB: An Introduction with Applications
6th Edition
ISBN:9781119256830
Author:Amos Gilat
Publisher:Amos Gilat
Chapter1: Starting With Matlab
Section: Chapter Questions
Problem 1P

Related questions
Topic Video
Question
Need help with 4, 5, and 6 both papers go hand in hand
![### Calculator Instructions for Regression Analysis
1. **Data Entry:**
- Input "Weeks on Market" into L1 (List 1).
- Input "Selling Price" into L2 (List 2).
2. **Accessing Regression Function:**
- Press [STAT].
- Use arrows to navigate to the CALC menu.
- Use arrows to go down to option 4: LinReg (ax+b).
3. **Data Selection:**
- Depending on your calculator version, select the list where your data is entered.
- Press the [ENTER] key.
### Analysis Questions
2. **Correlation Coefficient:**
- What is the value of the correlation coefficient? __________
3. **Interpreting Correlation:**
- Correlation indicates strength and direction. Discuss if your interpretation of this correlation matches the strength and direction found in the graph on page 1. Explain.
4. **Regression Coefficients:**
- Using calculator output from LinReg (ax+b), find:
- a = slope = __________
- b = y-intercept = __________
5. **Regression Equation:**
- Write out the regression equation: ____________________
6. **Prediction for Condos on Market:**
- Predict the selling price (in thousands of dollars) for a condo on the market for:
- **35 weeks:**
- **10 weeks:**
- **72 weeks:**
> This guide assists students in performing linear regression analysis to predict property sales based on market duration.](/v2/_next/image?url=https%3A%2F%2Fcontent.bartleby.com%2Fqna-images%2Fquestion%2Fafb35480-1da6-4606-ae06-eef29574bfe2%2F7d419356-e3c7-4316-bc67-6fde951e377d%2Fmra37pe_processed.jpeg&w=3840&q=75)
Transcribed Image Text:### Calculator Instructions for Regression Analysis
1. **Data Entry:**
- Input "Weeks on Market" into L1 (List 1).
- Input "Selling Price" into L2 (List 2).
2. **Accessing Regression Function:**
- Press [STAT].
- Use arrows to navigate to the CALC menu.
- Use arrows to go down to option 4: LinReg (ax+b).
3. **Data Selection:**
- Depending on your calculator version, select the list where your data is entered.
- Press the [ENTER] key.
### Analysis Questions
2. **Correlation Coefficient:**
- What is the value of the correlation coefficient? __________
3. **Interpreting Correlation:**
- Correlation indicates strength and direction. Discuss if your interpretation of this correlation matches the strength and direction found in the graph on page 1. Explain.
4. **Regression Coefficients:**
- Using calculator output from LinReg (ax+b), find:
- a = slope = __________
- b = y-intercept = __________
5. **Regression Equation:**
- Write out the regression equation: ____________________
6. **Prediction for Condos on Market:**
- Predict the selling price (in thousands of dollars) for a condo on the market for:
- **35 weeks:**
- **10 weeks:**
- **72 weeks:**
> This guide assists students in performing linear regression analysis to predict property sales based on market duration.

Transcribed Image Text:This educational material involves analyzing the relationship between weeks on the market and selling price, using the data provided below:
### Data Table
- **Weeks on Market:** 18 | **Selling Price (in thousands of $):** 125
- **Weeks on Market:** 48 | **Selling Price (in thousands of $):** 73
- **Weeks on Market:** 51 | **Selling Price (in thousands of $):** 61
- **Weeks on Market:** 33 | **Selling Price (in thousands of $):** 76.5
- **Weeks on Market:** 56 | **Selling Price (in thousands of $):** 53
- **Weeks on Market:** 9 | **Selling Price (in thousands of $):** 133
- **Weeks on Market:** 25 | **Selling Price (in thousands of $):** 94
- **Weeks on Market:** 47 | **Selling Price (in thousands of $):** 90
- **Weeks on Market:** 30 | **Selling Price (in thousands of $):** 107
- **Weeks on Market:** 27 | **Selling Price (in thousands of $):** 84
- **Weeks on Market:** 23 | **Selling Price (in thousands of $):** 54
- **Weeks on Market:** 16 | **Selling Price (in thousands of $):** 102
### Analysis Questions
Based on the given scatter plot:
- **Form:** Linear
- **Direction:** Negative
- **Strength:** Moderate
- **Outlier(s):** None
The task involves creating a scatter plot to visualize the data, helping in identifying trends such as the linear, negative, and moderate relationship between the length of time a property remains on the market and its selling price.
Expert Solution
Step 1
Given,

Step by step
Solved in 3 steps with 3 images

Knowledge Booster


Learn more about
Need a deep-dive on the concept behind this application? Look no further. Learn more about this topic, statistics and related others by exploring similar questions and additional content below.Recommended textbooks for you
MATLAB: An Introduction with Applications
Statistics
ISBN:
9781119256830
Author:
Amos Gilat
Publisher:
John Wiley & Sons Inc

Probability and Statistics for Engineering and th…
Statistics
ISBN:
9781305251809
Author:
Jay L. Devore
Publisher:
Cengage Learning

Statistics for The Behavioral Sciences (MindTap C…
Statistics
ISBN:
9781305504912
Author:
Frederick J Gravetter, Larry B. Wallnau
Publisher:
Cengage Learning
MATLAB: An Introduction with Applications
Statistics
ISBN:
9781119256830
Author:
Amos Gilat
Publisher:
John Wiley & Sons Inc
Probability and Statistics for Engineering and th…
Statistics
ISBN:
9781305251809
Author:
Jay L. Devore
Publisher:
Cengage Learning
Statistics for The Behavioral Sciences (MindTap C…
Statistics
ISBN:
9781305504912
Author:
Frederick J Gravetter, Larry B. Wallnau
Publisher:
Cengage Learning

Elementary Statistics: Picturing the World (7th E…
Statistics
ISBN:
9780134683416
Author:
Ron Larson, Betsy Farber
Publisher:
PEARSON

The Basic Practice of Statistics
Statistics
ISBN:
9781319042578
Author:
David S. Moore, William I. Notz, Michael A. Fligner
Publisher:
W. H. Freeman

Introduction to the Practice of Statistics
Statistics
ISBN:
9781319013387
Author:
David S. Moore, George P. McCabe, Bruce A. Craig
Publisher:
W. H. Freeman