We have 10 red shirts and 90 blue shirts. We begin to randomly pull shirts out of our giant drawer and find the following relative frequencies. Shirt Color ir b b b r b b Probability of red shirt 1 0.5 0.33 0.25 0.2 0.33 0.28 0.25 0.22 After 9 trials, what is our empirical probability that we pull a red shirt? [Select] What is our theoretical probability that we pull a red shirt? [Select] If we ran the simulation an infinity amount of times, what would the probability be that we pull a red shirt? [Select]
We have 10 red shirts and 90 blue shirts. We begin to randomly pull shirts out of our giant drawer and find the following relative frequencies. Shirt Color ir b b b r b b Probability of red shirt 1 0.5 0.33 0.25 0.2 0.33 0.28 0.25 0.22 After 9 trials, what is our empirical probability that we pull a red shirt? [Select] What is our theoretical probability that we pull a red shirt? [Select] If we ran the simulation an infinity amount of times, what would the probability be that we pull a red shirt? [Select]

MATLAB: An Introduction with Applications
6th Edition
ISBN:9781119256830
Author:Amos Gilat
Publisher:Amos Gilat
Chapter1: Starting With Matlab
Section: Chapter Questions
Problem 1P

Related questions
Question
![We have 10 red shirts and 90 blue shirts. We begin to randomly pull shirts out of our
giant drawer and find the following relative frequencies.
Shirt
Color
L
ir
b
b
b
b
r
b
b
b
Probability
of red
shirt
1
0.5
0.33
0.25
0.2
0.33
0.28
0.25
0.22
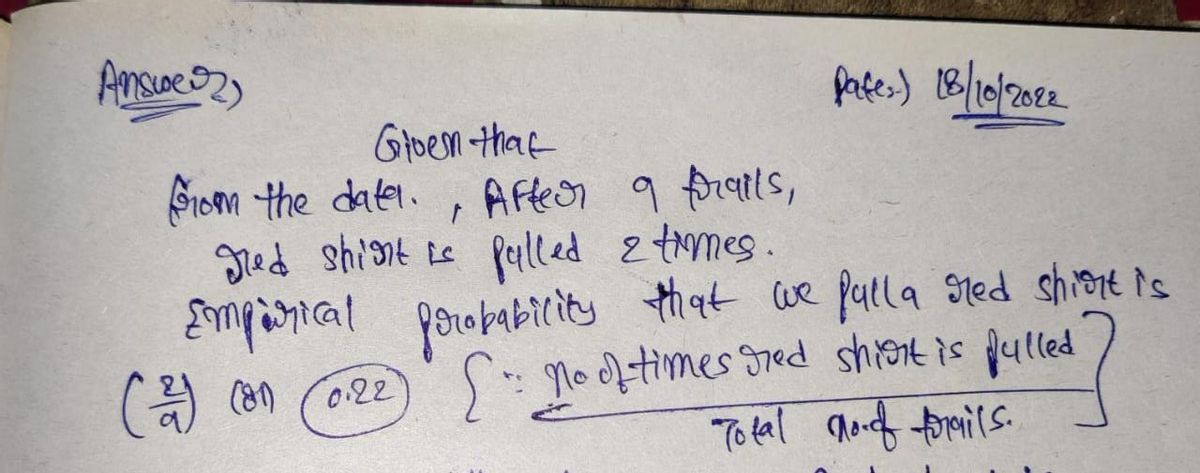
After 9 trials, what is our empirical probability that we pull a red shirt?
[Select]
What is our theoretical probability that we pull a red shirt?
[Select]
If we ran the simulation an infinity amount of times, what would the probability be
that we pull a red shirt? [Select]](/v2/_next/image?url=https%3A%2F%2Fcontent.bartleby.com%2Fqna-images%2Fquestion%2F1dd1c328-f311-4a98-a83c-fd70b60706e5%2F5f7da3c8-bc27-43b1-9141-e9f23e1babcf%2F4i9ar28_processed.jpeg&w=3840&q=75)
Transcribed Image Text:We have 10 red shirts and 90 blue shirts. We begin to randomly pull shirts out of our
giant drawer and find the following relative frequencies.
Shirt
Color
L
ir
b
b
b
b
r
b
b
b
Probability
of red
shirt
1
0.5
0.33
0.25
0.2
0.33
0.28
0.25
0.22
After 9 trials, what is our empirical probability that we pull a red shirt?
[Select]
What is our theoretical probability that we pull a red shirt?
[Select]
If we ran the simulation an infinity amount of times, what would the probability be
that we pull a red shirt? [Select]
Expert Solution
Step 1

Trending now
This is a popular solution!

Step by step
Solved in 2 steps with 2 images

Recommended textbooks for you
MATLAB: An Introduction with Applications
Statistics
ISBN:
9781119256830
Author:
Amos Gilat
Publisher:
John Wiley & Sons Inc

Probability and Statistics for Engineering and th…
Statistics
ISBN:
9781305251809
Author:
Jay L. Devore
Publisher:
Cengage Learning

Statistics for The Behavioral Sciences (MindTap C…
Statistics
ISBN:
9781305504912
Author:
Frederick J Gravetter, Larry B. Wallnau
Publisher:
Cengage Learning
MATLAB: An Introduction with Applications
Statistics
ISBN:
9781119256830
Author:
Amos Gilat
Publisher:
John Wiley & Sons Inc
Probability and Statistics for Engineering and th…
Statistics
ISBN:
9781305251809
Author:
Jay L. Devore
Publisher:
Cengage Learning
Statistics for The Behavioral Sciences (MindTap C…
Statistics
ISBN:
9781305504912
Author:
Frederick J Gravetter, Larry B. Wallnau
Publisher:
Cengage Learning

Elementary Statistics: Picturing the World (7th E…
Statistics
ISBN:
9780134683416
Author:
Ron Larson, Betsy Farber
Publisher:
PEARSON

The Basic Practice of Statistics
Statistics
ISBN:
9781319042578
Author:
David S. Moore, William I. Notz, Michael A. Fligner
Publisher:
W. H. Freeman

Introduction to the Practice of Statistics
Statistics
ISBN:
9781319013387
Author:
David S. Moore, George P. McCabe, Bruce A. Craig
Publisher:
W. H. Freeman