
Algebra and Trigonometry (6th Edition)
6th Edition
ISBN:9780134463216
Author:Robert F. Blitzer
Publisher:Robert F. Blitzer
ChapterP: Prerequisites: Fundamental Concepts Of Algebra
Section: Chapter Questions
Problem 1MCCP: In Exercises 1-25, simplify the given expression or perform the indicated operation (and simplify,...

Related questions
Question
100%
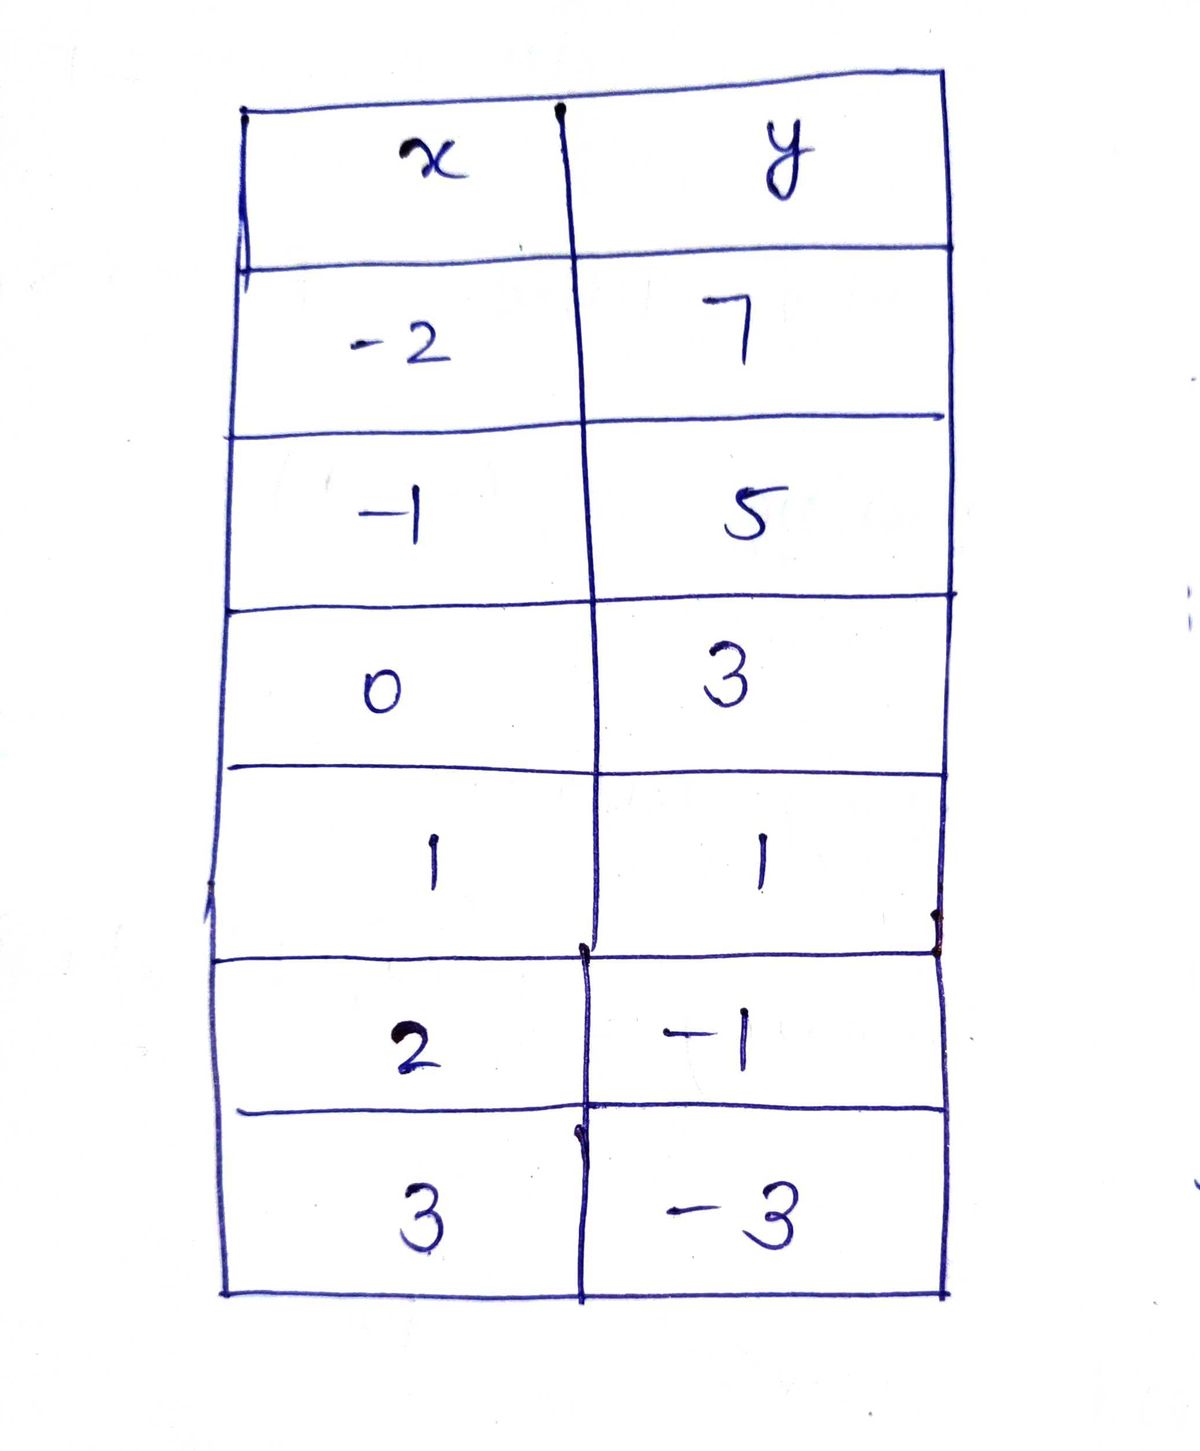
Write the equation for the table of values and graph it.
2. Show 3 pints and connect the points.
Help please! I’m confused
![The table below presents a set of values for the variables \(x\) and \(y\). This data can be used to analyze the relationship between these variables, potentially to study linear trends or other mathematical properties.
\[
\begin{array}{|c|c|}
\hline
x & y \\
\hline
-2 & 7 \\
\hline
-1 & 5 \\
\hline
0 & 3 \\
\hline
1 & 1 \\
\hline
2 & -1 \\
\hline
3 & -3 \\
\hline
\end{array}
\]
This table lists pairs of \(x\) and \(y\) such that each row corresponds to a unique combination. The \(x\) values range from \(-2\) to \(3\), and the \(y\) values decrease progressively by a consistent difference of 2 as \(x\) increases by 1. This suggests a linear relationship between \(x\) and \(y\).](/v2/_next/image?url=https%3A%2F%2Fcontent.bartleby.com%2Fqna-images%2Fquestion%2F9a3fd98d-1ca1-4ccd-aee3-22d706602e6b%2Ff7a27b8b-273b-4b2d-95c0-1a7be29257f7%2Fba3qstr_processed.jpeg&w=3840&q=75)
Transcribed Image Text:The table below presents a set of values for the variables \(x\) and \(y\). This data can be used to analyze the relationship between these variables, potentially to study linear trends or other mathematical properties.
\[
\begin{array}{|c|c|}
\hline
x & y \\
\hline
-2 & 7 \\
\hline
-1 & 5 \\
\hline
0 & 3 \\
\hline
1 & 1 \\
\hline
2 & -1 \\
\hline
3 & -3 \\
\hline
\end{array}
\]
This table lists pairs of \(x\) and \(y\) such that each row corresponds to a unique combination. The \(x\) values range from \(-2\) to \(3\), and the \(y\) values decrease progressively by a consistent difference of 2 as \(x\) increases by 1. This suggests a linear relationship between \(x\) and \(y\).

Transcribed Image Text:The image shows a Cartesian coordinate plane with a grid.
**Description:**
- **Axes:**
- The horizontal axis is labeled as the x-axis.
- The vertical axis is labeled as the y-axis.
- **Scale:**
- The x-axis ranges from -6 to 6.
- The y-axis ranges from -6 to 6.
- Both axes are incremented by 1 unit per mark.
- **Quadrants:**
- The grid is divided into four quadrants, with the intersection of the x and y axes (the origin) at the center, marked as (0,0).
- **Grid:**
- The background is filled with square grid lines that help in plotting points and understanding the position relative to each axis.
This standard Cartesian coordinate plane is used for graphing linear equations, plotting data points, and performing various mathematical analyses.
Expert Solution
Step 1

Step by step
Solved in 3 steps with 3 images

Recommended textbooks for you
Algebra and Trigonometry (6th Edition)
Algebra
ISBN:
9780134463216
Author:
Robert F. Blitzer
Publisher:
PEARSON

Contemporary Abstract Algebra
Algebra
ISBN:
9781305657960
Author:
Joseph Gallian
Publisher:
Cengage Learning

Linear Algebra: A Modern Introduction
Algebra
ISBN:
9781285463247
Author:
David Poole
Publisher:
Cengage Learning
Algebra and Trigonometry (6th Edition)
Algebra
ISBN:
9780134463216
Author:
Robert F. Blitzer
Publisher:
PEARSON
Contemporary Abstract Algebra
Algebra
ISBN:
9781305657960
Author:
Joseph Gallian
Publisher:
Cengage Learning
Linear Algebra: A Modern Introduction
Algebra
ISBN:
9781285463247
Author:
David Poole
Publisher:
Cengage Learning

Algebra And Trigonometry (11th Edition)
Algebra
ISBN:
9780135163078
Author:
Michael Sullivan
Publisher:
PEARSON

Introduction to Linear Algebra, Fifth Edition
Algebra
ISBN:
9780980232776
Author:
Gilbert Strang
Publisher:
Wellesley-Cambridge Press

College Algebra (Collegiate Math)
Algebra
ISBN:
9780077836344
Author:
Julie Miller, Donna Gerken
Publisher:
McGraw-Hill Education