Verify through listing all the possibilities of random graphs with three nodes that the probability that a graph with n-nodes is connected formula is correct when n=3
Verify through listing all the possibilities of random graphs with three nodes that the probability that a graph with n-nodes is connected formula is correct when n=3
A First Course in Probability (10th Edition)
10th Edition
ISBN:9780134753119
Author:Sheldon Ross
Publisher:Sheldon Ross
Chapter1: Combinatorial Analysis
Section: Chapter Questions
Problem 1.1P: a. How many different 7-place license plates are possible if the first 2 places are for letters and...
Related questions
Question

Transcribed Image Text:**Title: Exploring Connected Graphs with Three Nodes**
**Objective:**
Verify the probability that a graph with n-nodes is connected, specifically when n=3, by listing all possibilities of random graphs with three nodes.
**Overview:**
In this activity, we explore the concept of graph connectivity using a simple case of three nodes. By examining all possible configurations of edges between these nodes, we aim to understand the probability of forming a connected graph.
**Method:**
1. **List all Possible Graph Configurations:**
- Understand that with three nodes, each pair can either be connected by an edge or not.
- There are a total of three pairs: (1,2), (2,3), and (1,3).
2. **Possible Configurations:**
- No edges: The graph is not connected.
- One edge: Only one pair is connected; the graph is disconnected.
- Two edges: Two pairs are connected; the graph remains disconnected.
- Three edges: All pairs are connected; the graph is fully connected.
**Analysis:**
- **Connectivity Determination:** Out of all possible configurations, only one (all three edges present) forms a connected graph.
- **Probability Calculation:**
- Determine the number of configurations that result in a connected graph versus all possible configurations.
- Calculate probability as the ratio of connected configurations to total configurations.
**Conclusion:**
By analyzing these configurations, you can verify if the probability aligns with the theoretical formula for the probability of connectivity for a graph with n=3 nodes. This exercise demonstrates fundamental graph theory concepts and their practical probability implications.
---
**Graph Visualization:**
- If graphs are provided, each graph would typically show nodes as circles and edges as lines connecting them.
- Diagrams would depict various combinations of edges between the three nodes, aiding in visual comprehension of connected versus disconnected states.
This exercise is a foundational step in understanding more complex graph connectivity scenarios.
Expert Solution
This question has been solved!
Explore an expertly crafted, step-by-step solution for a thorough understanding of key concepts.
This is a popular solution!
Trending now
This is a popular solution!
Step by step
Solved in 2 steps

Follow-up Questions
Read through expert solutions to related follow-up questions below.
Follow-up Question
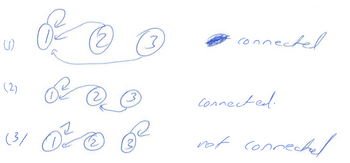
The question ask for "listing all the possibilities of random graphs with three nodes". The attached document lists the first 3 possibilities. Can you assist with additional possibilities?

Transcribed Image Text:agpouvos yan
connected.
connected
{
(2)
0²
/٤)
(ج)
Solution
Recommended textbooks for you

A First Course in Probability (10th Edition)
Probability
ISBN:
9780134753119
Author:
Sheldon Ross
Publisher:
PEARSON


A First Course in Probability (10th Edition)
Probability
ISBN:
9780134753119
Author:
Sheldon Ross
Publisher:
PEARSON
