Using the data in the plot below, calculate the value of the activation energy (in kJ/mol) for this reaction: 3.5 y-507.36x 3.866 R'=0.9687 25 2 1.5 0.5 0.002 0.003 0.004 0.005 0.006 0.007 0.008 0.009 1/T (1/K)
Using the data in the plot below, calculate the value of the activation energy (in kJ/mol) for this reaction: 3.5 y-507.36x 3.866 R'=0.9687 25 2 1.5 0.5 0.002 0.003 0.004 0.005 0.006 0.007 0.008 0.009 1/T (1/K)

Chemistry
10th Edition
ISBN:9781305957404
Author:Steven S. Zumdahl, Susan A. Zumdahl, Donald J. DeCoste
Publisher:Steven S. Zumdahl, Susan A. Zumdahl, Donald J. DeCoste
Chapter1: Chemical Foundations
Section: Chapter Questions
Problem 1RQ: Define and explain the differences between the following terms. a. law and theory b. theory and...

Related questions
Question
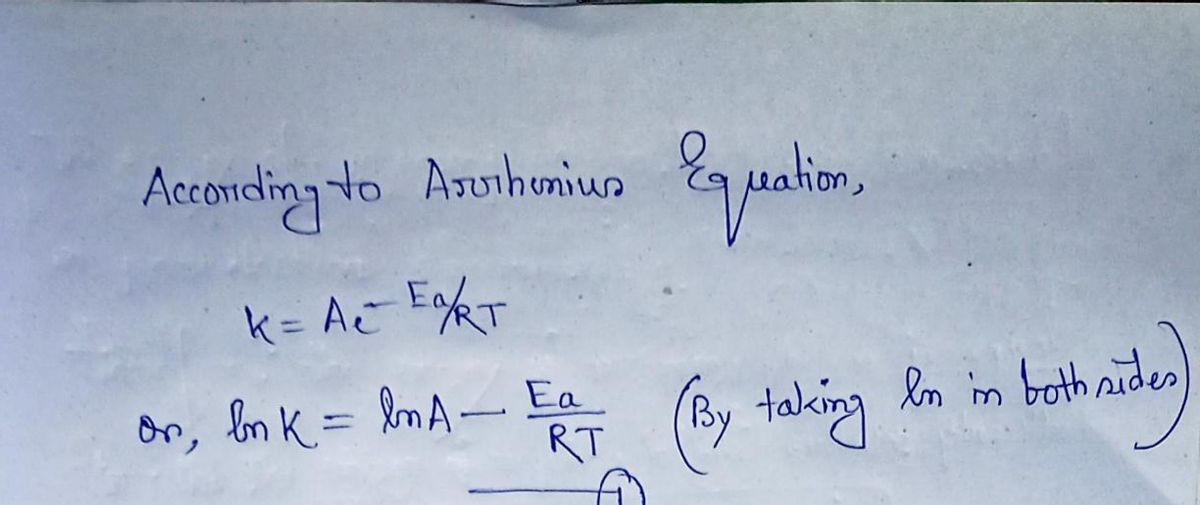
![**Title**: Calculating Activation Energy from a Plot
**Text**:
Using the data in the plot below, calculate the value of the activation energy (in kJ/mol) for this reaction.
**Graph Description**:
- The graph is a plot of ln(k) (natural logarithm of the rate constant) on the y-axis versus 1/T (temperature in Kelvin) on the x-axis.
- The x-axis is labeled as "1/T (1/K)" and ranges from 0.002 to 0.009.
- The y-axis is labeled as "ln k" and ranges from 0.5 to 3.5.
- Data points are plotted and a linear trend line is fitted to these points.
- The equation of the line is given as \(y = -5073.6x + 1.866\) with an R² value of 0.9687, indicating a good fit.
**Instruction**:
Use the equation of the line to determine the activation energy. The slope of the line is related to the activation energy by the formula:
\[ \text{Slope} = -\frac{E_a}{R} \]
where \(E_a\) is the activation energy and \(R\) is the universal gas constant (8.314 J/mol·K). Convert the energy to kJ/mol and solve for \(E_a\).](/v2/_next/image?url=https%3A%2F%2Fcontent.bartleby.com%2Fqna-images%2Fquestion%2Fa76617f8-0ae3-4ad6-88f5-237d1bacce0f%2Fdc793686-6b6a-4b09-8ddd-75e9d1259cfc%2Fspxwi7o_processed.jpeg&w=3840&q=75)
Transcribed Image Text:**Title**: Calculating Activation Energy from a Plot
**Text**:
Using the data in the plot below, calculate the value of the activation energy (in kJ/mol) for this reaction.
**Graph Description**:
- The graph is a plot of ln(k) (natural logarithm of the rate constant) on the y-axis versus 1/T (temperature in Kelvin) on the x-axis.
- The x-axis is labeled as "1/T (1/K)" and ranges from 0.002 to 0.009.
- The y-axis is labeled as "ln k" and ranges from 0.5 to 3.5.
- Data points are plotted and a linear trend line is fitted to these points.
- The equation of the line is given as \(y = -5073.6x + 1.866\) with an R² value of 0.9687, indicating a good fit.
**Instruction**:
Use the equation of the line to determine the activation energy. The slope of the line is related to the activation energy by the formula:
\[ \text{Slope} = -\frac{E_a}{R} \]
where \(E_a\) is the activation energy and \(R\) is the universal gas constant (8.314 J/mol·K). Convert the energy to kJ/mol and solve for \(E_a\).
Expert Solution
Step 1

Step by step
Solved in 2 steps with 2 images

Knowledge Booster


Learn more about
Need a deep-dive on the concept behind this application? Look no further. Learn more about this topic, chemistry and related others by exploring similar questions and additional content below.Recommended textbooks for you
Chemistry
Chemistry
ISBN:
9781305957404
Author:
Steven S. Zumdahl, Susan A. Zumdahl, Donald J. DeCoste
Publisher:
Cengage Learning

Chemistry
Chemistry
ISBN:
9781259911156
Author:
Raymond Chang Dr., Jason Overby Professor
Publisher:
McGraw-Hill Education

Principles of Instrumental Analysis
Chemistry
ISBN:
9781305577213
Author:
Douglas A. Skoog, F. James Holler, Stanley R. Crouch
Publisher:
Cengage Learning
Chemistry
Chemistry
ISBN:
9781305957404
Author:
Steven S. Zumdahl, Susan A. Zumdahl, Donald J. DeCoste
Publisher:
Cengage Learning
Chemistry
Chemistry
ISBN:
9781259911156
Author:
Raymond Chang Dr., Jason Overby Professor
Publisher:
McGraw-Hill Education
Principles of Instrumental Analysis
Chemistry
ISBN:
9781305577213
Author:
Douglas A. Skoog, F. James Holler, Stanley R. Crouch
Publisher:
Cengage Learning

Organic Chemistry
Chemistry
ISBN:
9780078021558
Author:
Janice Gorzynski Smith Dr.
Publisher:
McGraw-Hill Education

Chemistry: Principles and Reactions
Chemistry
ISBN:
9781305079373
Author:
William L. Masterton, Cecile N. Hurley
Publisher:
Cengage Learning

Elementary Principles of Chemical Processes, Bind…
Chemistry
ISBN:
9781118431221
Author:
Richard M. Felder, Ronald W. Rousseau, Lisa G. Bullard
Publisher:
WILEY