Using the data given in the table below, answer the following questions. (Round your final answers to 3 decimal places.) Moviegoer Snack Spending (n = 10) Spent (Y) Age (X) 28 49 35 13 39 34 37 27 18 43 rcalc 2.72 6.56 1.58 6.35 6.12 6.75 3.65 Click here for the Excel Data File (a) Use Excel, MegaStat, or MINITAB to calculate the correlation coefficient. (A negative value should be indicated by a minus sign.) 6.07 8.24 4.27 1.025 (b) Use Excel or Appendix D to find t025 for a two-tailed test at a = .05.
Using the data given in the table below, answer the following questions. (Round your final answers to 3 decimal places.) Moviegoer Snack Spending (n = 10) Spent (Y) Age (X) 28 49 35 13 39 34 37 27 18 43 rcalc 2.72 6.56 1.58 6.35 6.12 6.75 3.65 Click here for the Excel Data File (a) Use Excel, MegaStat, or MINITAB to calculate the correlation coefficient. (A negative value should be indicated by a minus sign.) 6.07 8.24 4.27 1.025 (b) Use Excel or Appendix D to find t025 for a two-tailed test at a = .05.

MATLAB: An Introduction with Applications
6th Edition
ISBN:9781119256830
Author:Amos Gilat
Publisher:Amos Gilat
Chapter1: Starting With Matlab
Section: Chapter Questions
Problem 1P

Related questions
Question

Transcribed Image Text:Using the data given in the table below, answer the following questions. (Round your final answers to 3 decimal places.)
Moviegoer Snack Spending (n = 10)
Age (X)
Spent (Y)
28
49
35
13
39
34
37
27
18
43
Click here for the Excel Data File
(a) Use Excel, MegaStat, or MINITAB to calculate the correlation coefficient. (A negative value should be indicated by a minus sign.)
rcalc
2.72
6.56
1.58
6.35
6.12
6.75
3.65
6.07
8.24
4.27
(b) Use Excel or Appendix D to find t025 for a two-tailed test at a = .05.
1.025

Transcribed Image Text:(b) Use Excel or Appendix D to find t025 for a two-tailed test at a = .05.
t.025
+
(c) Calculate the test statistic. (A negative value should be indicated by a minus sign.)
tcalc
(d) Should we reject the null hypothesis of zero correlation?
O No
O Yes
Expert Solution
Step 1
Since you have posted a question with multiple sub-parts, we will solve first three sub-
parts for you. To get remaining sub-part solved please repost the complete question and
mention the sub-parts to be solved
(a)
Use EXCEL to obtain the value correlation coefficient r:
EXCEL procedure:
- Go to EXCEL
- Go to Data>Data Analysis.
- Choose Correlation.
- Enter the range as $A$1:$B$11
- Check the option Labels in First row.
- Click OK.
EXCEL output:
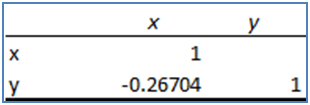
From the EXCEL output, the value of the correlation coefficient is –0.267
Thus, the value of correlation coefficient is –0.267.

Step by step
Solved in 3 steps with 3 images

Recommended textbooks for you
MATLAB: An Introduction with Applications
Statistics
ISBN:
9781119256830
Author:
Amos Gilat
Publisher:
John Wiley & Sons Inc

Probability and Statistics for Engineering and th…
Statistics
ISBN:
9781305251809
Author:
Jay L. Devore
Publisher:
Cengage Learning

Statistics for The Behavioral Sciences (MindTap C…
Statistics
ISBN:
9781305504912
Author:
Frederick J Gravetter, Larry B. Wallnau
Publisher:
Cengage Learning
MATLAB: An Introduction with Applications
Statistics
ISBN:
9781119256830
Author:
Amos Gilat
Publisher:
John Wiley & Sons Inc
Probability and Statistics for Engineering and th…
Statistics
ISBN:
9781305251809
Author:
Jay L. Devore
Publisher:
Cengage Learning
Statistics for The Behavioral Sciences (MindTap C…
Statistics
ISBN:
9781305504912
Author:
Frederick J Gravetter, Larry B. Wallnau
Publisher:
Cengage Learning

Elementary Statistics: Picturing the World (7th E…
Statistics
ISBN:
9780134683416
Author:
Ron Larson, Betsy Farber
Publisher:
PEARSON

The Basic Practice of Statistics
Statistics
ISBN:
9781319042578
Author:
David S. Moore, William I. Notz, Michael A. Fligner
Publisher:
W. H. Freeman

Introduction to the Practice of Statistics
Statistics
ISBN:
9781319013387
Author:
David S. Moore, George P. McCabe, Bruce A. Craig
Publisher:
W. H. Freeman