Using the accompanying data, develop a cross-tabulation for Gender and Vehicle Driven; then convert this table into probabilities. a. What is the probability that the respondent is female? b. What is the probability that the respondent drives an SUV? c. What is the probability that a respondent is male and drives a minivan? d What ic tho probohiliti
Using the accompanying data, develop a cross-tabulation for Gender and Vehicle Driven; then convert this table into probabilities. a. What is the probability that the respondent is female? b. What is the probability that the respondent drives an SUV? c. What is the probability that a respondent is male and drives a minivan? d What ic tho probohiliti

MATLAB: An Introduction with Applications
6th Edition
ISBN:9781119256830
Author:Amos Gilat
Publisher:Amos Gilat
Chapter1: Starting With Matlab
Section: Chapter Questions
Problem 1P

Related questions
Question
5) see pictures

Transcribed Image Text:Vehicle Driven
Truck
Truck
Truck
Truck
SUV
SUV
SUV
Gender
Male
Male
Male
Male
Male
Male
Male
Male
SUV
SUV
SUV
Female
Male
SUV
SUV
SUV
Male
Male
Female
SUV
SUV
SUV
SUV
SUV
Female
Female
Female
Female
Female
Male
Female
Female
Female
Female
SUV
Minivan
Minivan
Minivan
Minivan
Minivan
Minivan
Minivan
Minivan
Minivan
Car
Car
Female
Male
Female
Female
Female
Female
Female
Female
Male
Male
Female
Female
Male
Male
Female
Female
Female
Female
Female
Male
Male
Female
Female
Female
Female
Female,
Female
Car
Car
Car
Car
Car
Car
Car
Car
Car
Car
Car
Car
Car
Car
Car
Car
Car
Car
Car
Car

Transcribed Image Text:Using the accompanying data, develop a cross-tabulation for Gender and Vehicle Driven; then convert this table into probabilities.
a. What is the probability that the respondent is female?
b. What is the probability that the respondent drives an SUV?
c. What is the probability that a respondent is male and drives a minivan?
d. What is the probability that a female respondent drives either a truck or an SUV?
e. If it is known that an individual drives a car, what is the probability that the individual is female?
f. If it is known that an individual is male, what is the probability that he drives an SUV?
g. Determine whether the random variable "gender" and the event "vehicle driven" are statistically independent. What would this mean for advertisers?
Click the icon to view gender and vehicle driven data.
a. The probability that the respondent is female is
(Type an integer or a decimal. Do not round.)
Expert Solution
Step 1
Since you have posted a question with multiple sub-parts, we will solve first three sub-parts for you. To get remaining sub-part solved please repost the complete question and mention the sub-parts to be solved.
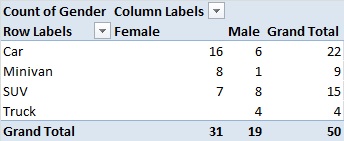
Step-by-step software procedure to obtain cross-tabulation using EXCEL is as follows:
- Choose Insert > PivotTable > PivotTable.
- In Table/Range, select cells of Sheet1!$A$1:$B$51.
- Click OK.
- Drag and drop Vehicle Driven under Choose fields to add to report to Row Labels under Drag fields between areas below.
- Drag and drop Gender under Choose fields to add to report to Column Labels under Drag fields between areas below.
- Drag and drop Gender under Choose fields to add to report to Values under Drag fields between areas below.
Output using Excel software is given below:

Trending now
This is a popular solution!

Step by step
Solved in 2 steps with 1 images

Knowledge Booster


Learn more about
Need a deep-dive on the concept behind this application? Look no further. Learn more about this topic, statistics and related others by exploring similar questions and additional content below.Recommended textbooks for you
MATLAB: An Introduction with Applications
Statistics
ISBN:
9781119256830
Author:
Amos Gilat
Publisher:
John Wiley & Sons Inc

Probability and Statistics for Engineering and th…
Statistics
ISBN:
9781305251809
Author:
Jay L. Devore
Publisher:
Cengage Learning

Statistics for The Behavioral Sciences (MindTap C…
Statistics
ISBN:
9781305504912
Author:
Frederick J Gravetter, Larry B. Wallnau
Publisher:
Cengage Learning
MATLAB: An Introduction with Applications
Statistics
ISBN:
9781119256830
Author:
Amos Gilat
Publisher:
John Wiley & Sons Inc
Probability and Statistics for Engineering and th…
Statistics
ISBN:
9781305251809
Author:
Jay L. Devore
Publisher:
Cengage Learning
Statistics for The Behavioral Sciences (MindTap C…
Statistics
ISBN:
9781305504912
Author:
Frederick J Gravetter, Larry B. Wallnau
Publisher:
Cengage Learning

Elementary Statistics: Picturing the World (7th E…
Statistics
ISBN:
9780134683416
Author:
Ron Larson, Betsy Farber
Publisher:
PEARSON

The Basic Practice of Statistics
Statistics
ISBN:
9781319042578
Author:
David S. Moore, William I. Notz, Michael A. Fligner
Publisher:
W. H. Freeman

Introduction to the Practice of Statistics
Statistics
ISBN:
9781319013387
Author:
David S. Moore, George P. McCabe, Bruce A. Craig
Publisher:
W. H. Freeman