Use the sample data and confidence level given below to complete parts (a) through (d). A research institute poll asked respondents if they felt vulnerable to identity theft. In the poll, n= 1065 and x = 565 who said "yes" Use a 95% confidence level. E Click the icon to view a table of z scores. a) Find the best point estimate of the population proportion p. (Round to three decimal places as needed) b) ldentify the value of the margin of error E. E=0 (Round to three decimal places as needed.) c) Construct the confidence interval. (Round to three decimal places as needed.) d) Write a statement that correctly interprets the confidence interval. Choose the correct answer below. O A. One has 95% confidence that the interval from the lower bound to the upper bound actually does contain the true value of the population proportion. O B. One has 95% confidence that the sample proportion is equal to the population proportion. c. 95% of sample proportions will fall between the lower bound and the upper bound.
Use the sample data and confidence level given below to complete parts (a) through (d). A research institute poll asked respondents if they felt vulnerable to identity theft. In the poll, n= 1065 and x = 565 who said "yes" Use a 95% confidence level. E Click the icon to view a table of z scores. a) Find the best point estimate of the population proportion p. (Round to three decimal places as needed) b) ldentify the value of the margin of error E. E=0 (Round to three decimal places as needed.) c) Construct the confidence interval. (Round to three decimal places as needed.) d) Write a statement that correctly interprets the confidence interval. Choose the correct answer below. O A. One has 95% confidence that the interval from the lower bound to the upper bound actually does contain the true value of the population proportion. O B. One has 95% confidence that the sample proportion is equal to the population proportion. c. 95% of sample proportions will fall between the lower bound and the upper bound.

MATLAB: An Introduction with Applications
6th Edition
ISBN:9781119256830
Author:Amos Gilat
Publisher:Amos Gilat
Chapter1: Starting With Matlab
Section: Chapter Questions
Problem 1P

Related questions

Topic Video
Question
![Use the sample data and confidence level given below to complete parts (a) through (d).
A research institute poll asked respondents if they felt vulnerable to identity theft. In the poll, \( n = 1065 \) and \( x = 565 \) who said "yes." Use a 95% confidence level.
a) Find the best point estimate of the population proportion \( p \).
\[
\text{(Round to three decimal places as needed.)}
\]
b) Identify the value of the margin of error \( E \).
\[ E = \]
\[
\text{(Round to three decimal places as needed.)}
\]
c) Construct the confidence interval.
\[
< p <
\]
\[
\text{(Round to three decimal places as needed.)}
\]
d) Write a statement that correctly interprets the confidence interval. Choose the correct answer below.
- A. One has 95% confidence that the interval from the lower bound to the upper bound actually does contain the true value of the population proportion.
- B. One has 95% confidence that the sample proportion is equal to the population proportion.
- C. 95% of sample proportions will fall between the lower bound and the upper bound.](/v2/_next/image?url=https%3A%2F%2Fcontent.bartleby.com%2Fqna-images%2Fquestion%2Fc4f9ae8f-01da-42d4-8f33-486d1da6a186%2Faad91588-f544-4ef1-8c19-c3921d7b2780%2Fct6lck_processed.png&w=3840&q=75)
Transcribed Image Text:Use the sample data and confidence level given below to complete parts (a) through (d).
A research institute poll asked respondents if they felt vulnerable to identity theft. In the poll, \( n = 1065 \) and \( x = 565 \) who said "yes." Use a 95% confidence level.
a) Find the best point estimate of the population proportion \( p \).
\[
\text{(Round to three decimal places as needed.)}
\]
b) Identify the value of the margin of error \( E \).
\[ E = \]
\[
\text{(Round to three decimal places as needed.)}
\]
c) Construct the confidence interval.
\[
< p <
\]
\[
\text{(Round to three decimal places as needed.)}
\]
d) Write a statement that correctly interprets the confidence interval. Choose the correct answer below.
- A. One has 95% confidence that the interval from the lower bound to the upper bound actually does contain the true value of the population proportion.
- B. One has 95% confidence that the sample proportion is equal to the population proportion.
- C. 95% of sample proportions will fall between the lower bound and the upper bound.
Expert Solution
Step 1
From the provided information,
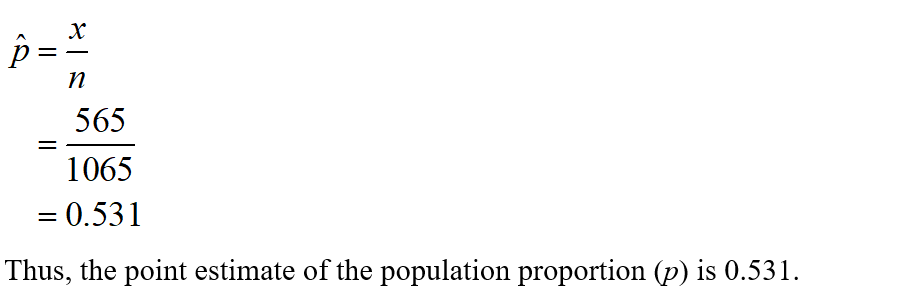
Sample size (n) = 1065, x = 565
a)
The best point estimate of the population proportion is sample proportion.
Thus, the required sample proportion can be obtained as:
Step 2
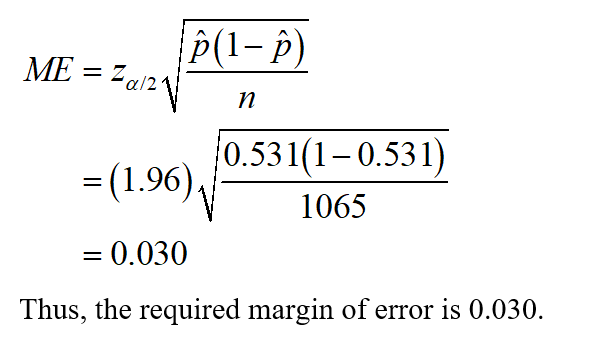
b)
Confidence level = 95%
The z value at 95% confidence level from the standard normal table is 1.96.
The required margin of error can be obtained as:

Trending now
This is a popular solution!

Step by step
Solved in 4 steps with 3 images

Knowledge Booster


Learn more about
Need a deep-dive on the concept behind this application? Look no further. Learn more about this topic, statistics and related others by exploring similar questions and additional content below.Recommended textbooks for you
MATLAB: An Introduction with Applications
Statistics
ISBN:
9781119256830
Author:
Amos Gilat
Publisher:
John Wiley & Sons Inc

Probability and Statistics for Engineering and th…
Statistics
ISBN:
9781305251809
Author:
Jay L. Devore
Publisher:
Cengage Learning

Statistics for The Behavioral Sciences (MindTap C…
Statistics
ISBN:
9781305504912
Author:
Frederick J Gravetter, Larry B. Wallnau
Publisher:
Cengage Learning
MATLAB: An Introduction with Applications
Statistics
ISBN:
9781119256830
Author:
Amos Gilat
Publisher:
John Wiley & Sons Inc
Probability and Statistics for Engineering and th…
Statistics
ISBN:
9781305251809
Author:
Jay L. Devore
Publisher:
Cengage Learning
Statistics for The Behavioral Sciences (MindTap C…
Statistics
ISBN:
9781305504912
Author:
Frederick J Gravetter, Larry B. Wallnau
Publisher:
Cengage Learning

Elementary Statistics: Picturing the World (7th E…
Statistics
ISBN:
9780134683416
Author:
Ron Larson, Betsy Farber
Publisher:
PEARSON

The Basic Practice of Statistics
Statistics
ISBN:
9781319042578
Author:
David S. Moore, William I. Notz, Michael A. Fligner
Publisher:
W. H. Freeman

Introduction to the Practice of Statistics
Statistics
ISBN:
9781319013387
Author:
David S. Moore, George P. McCabe, Bruce A. Craig
Publisher:
W. H. Freeman