The accompanying data table shows quarterly observations on income (Y) and money supply (X) in a certain country. Estimate the model y₁ = Bo + B₁× + YY₁−1+& and write a report on your findings. Click the icon to view the data table. Write a report on your findings. Predictor Constant Coef SE Coef T P
The accompanying data table shows quarterly observations on income (Y) and money supply (X) in a certain country. Estimate the model y₁ = Bo + B₁× + YY₁−1+& and write a report on your findings. Click the icon to view the data table. Write a report on your findings. Predictor Constant Coef SE Coef T P
MATLAB: An Introduction with Applications
6th Edition
ISBN:9781119256830
Author:Amos Gilat
Publisher:Amos Gilat
Chapter1: Starting With Matlab
Section: Chapter Questions
Problem 1P
Related questions
Question
Income (Y) Money Supply (X)
116,652 42,011
120,392 43,313
124,572 44,808
132,624 48,056
139,656 50,094
144,752 52,117
150,164 54,253
153,560 56,512
157,328 59,243
161,740 60,783
168,732 64,782
180,002 66,338
182,744 68,694
190,172 72,238
191,592 74,544
195,600 77,300
201,204 80,021
204,160 83,482
207,827 85,868
214,712 87,911

Transcribed Image Text:The accompanying data table shows quarterly observations on income (Y) and money supply (X) in a certain country.
Estimate the model y₁ =B₁ + B₁×₁ + YY₁ - 1 + & and write a report on your findings.
Click the icon to view the data table.
Write a report on your findings.
Predictor
Constant
X_MoneySupply
Y_lagIncome
S=
Coef
R-Sq=
%
SE Coef
R-Sq(adj) =
T
%
P
Expert Solution
This question has been solved!
Explore an expertly crafted, step-by-step solution for a thorough understanding of key concepts.
Step by step
Solved in 4 steps with 3 images

Follow-up Questions
Read through expert solutions to related follow-up questions below.
Follow-up Question

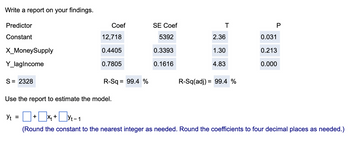
Transcribed Image Text:Write a report on your findings.
Predictor
Constant
X_MoneySupply
Y_lagIncome
S = 2328
Coef
12,718
0.4405
0.7805
R-Sq= 99.4 %
Use the report to estimate the model.
SE Coef
5392
0.3393
0.1616
T
2.36
1.30
4.83
R-Sq(adj) = 99.4 %
P
0.031
0.213
0.000
Y₁ = + x₁ +t-1
Yt
(Round the constant to the nearest integer as needed. Round the coefficients to four decimal places as needed.)
Solution
Recommended textbooks for you

MATLAB: An Introduction with Applications
Statistics
ISBN:
9781119256830
Author:
Amos Gilat
Publisher:
John Wiley & Sons Inc

Probability and Statistics for Engineering and th…
Statistics
ISBN:
9781305251809
Author:
Jay L. Devore
Publisher:
Cengage Learning

Statistics for The Behavioral Sciences (MindTap C…
Statistics
ISBN:
9781305504912
Author:
Frederick J Gravetter, Larry B. Wallnau
Publisher:
Cengage Learning

MATLAB: An Introduction with Applications
Statistics
ISBN:
9781119256830
Author:
Amos Gilat
Publisher:
John Wiley & Sons Inc

Probability and Statistics for Engineering and th…
Statistics
ISBN:
9781305251809
Author:
Jay L. Devore
Publisher:
Cengage Learning

Statistics for The Behavioral Sciences (MindTap C…
Statistics
ISBN:
9781305504912
Author:
Frederick J Gravetter, Larry B. Wallnau
Publisher:
Cengage Learning

Elementary Statistics: Picturing the World (7th E…
Statistics
ISBN:
9780134683416
Author:
Ron Larson, Betsy Farber
Publisher:
PEARSON

The Basic Practice of Statistics
Statistics
ISBN:
9781319042578
Author:
David S. Moore, William I. Notz, Michael A. Fligner
Publisher:
W. H. Freeman

Introduction to the Practice of Statistics
Statistics
ISBN:
9781319013387
Author:
David S. Moore, George P. McCabe, Bruce A. Craig
Publisher:
W. H. Freeman