Use the Leading Coefficient Test to determine the end behavior of the graph of the given polynomial function. Then use this end behavior to match the polynomial function with its graph. G Drag each graph given above into the area below the appropriate function, depending on which graph is represented by which function. 18.f(x) = -x³-x² + 4x-1 15. f(x) = -x¹ + x² 16. f(x)=x³-4x² 17. f(x) = (x - 5)2
Use the Leading Coefficient Test to determine the end behavior of the graph of the given polynomial function. Then use this end behavior to match the polynomial function with its graph. G Drag each graph given above into the area below the appropriate function, depending on which graph is represented by which function. 18.f(x) = -x³-x² + 4x-1 15. f(x) = -x¹ + x² 16. f(x)=x³-4x² 17. f(x) = (x - 5)2
Use the Leading Coefficient Test to determine the end behavior of the graph of the given polynomial function. Then use this end behavior to match the polynomial function with its graph. G Drag each graph given above into the area below the appropriate function, depending on which graph is represented by which function. 18.f(x) = -x³-x² + 4x-1 15. f(x) = -x¹ + x² 16. f(x)=x³-4x² 17. f(x) = (x - 5)2
Please write the steps of this question and circle the answer so that I can understand. Please write the answer in an organized way if possible so that I can understand and identify the numbers. For each step, please specify which answer corresponds to which step. I appreciate your understanding.
Transcribed Image Text:**Title: Understanding Polynomial End Behavior Using the Leading Coefficient Test**
Use the Leading Coefficient Test to determine the end behavior of the graph of the given polynomial function. Then use this end behavior to match the polynomial function with its graph.
**Graphs Overview:**
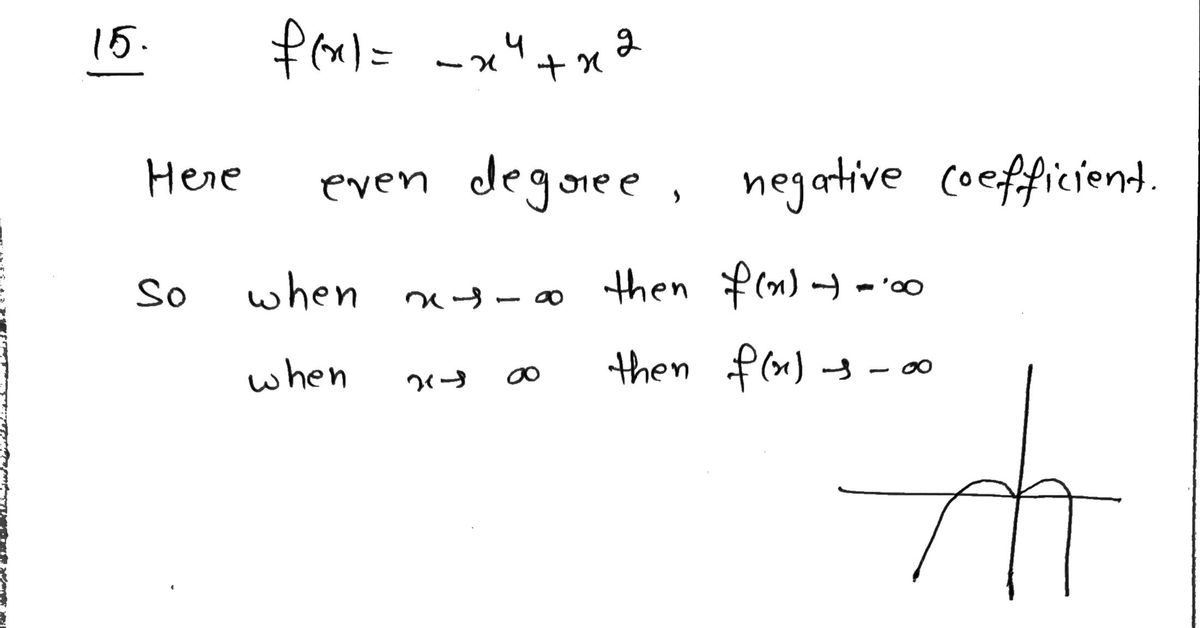
1. **Graph A**: A polynomial graph that opens downwards on both ends, resembling an inverted parabola. The curve starts from positive y-values, decreases, and then increases slightly before declining again.
2. **Graph B**: This graph begins from the top left, descends steeply, and then rises gradually as it moves to the right, creating a valley near the bottom of the y-axis.
3. **Graph C**: A graph that starts from the bottom left, rises, dips again, and then rises steeply, forming a hill-like shape.
4. **Graph D**: This curve comes from the bottom right, rises slightly, dips, and then ascends again as it moves towards the right.
**Exercise Instructions:**
Drag each graph given above into the area below the appropriate function, depending on which graph is represented by which function.
- **15. \( f(x) = -x^4 + x^2 \)**
- **16. \( f(x) = x^3 - 4x^2 \)**
- **17. \( f(x) = (x - 5)^2 \)**
- **18. \( f(x) = -x^3 - x^2 + 4x - 1 \)**
This exercise is designed to enhance your understanding of how polynomial functions' end behavior is influenced by their leading coefficients and how this can help in identifying their respective graphs.
Two-dimensional figure measured in terms of radius. It is formed by a set of points that are at a constant or fixed distance from a fixed point in the center of the plane. The parts of the circle are circumference, radius, diameter, chord, tangent, secant, arc of a circle, and segment in a circle.