Use the graph to answer the following questions.

Advanced Engineering Mathematics
10th Edition
ISBN:9780470458365
Author:Erwin Kreyszig
Publisher:Erwin Kreyszig
Chapter2: Second-order Linear Odes
Section: Chapter Questions
Problem 1RQ

Related questions
Question
![**Objective Knowledge Check**
**Question 4**
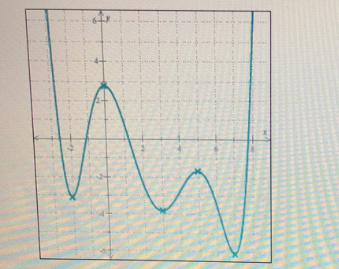
Below is the graph of a polynomial function with real coefficients. All local extrema of the function are shown in the graph.
[Graph of a polynomial]
**Description of the Graph:**
The graph shows a polynomial curve with fluctuations, having local maxima and minima. The x-axis is marked at intervals with values such as -6, -4, -2, 0, 2, 4, 6, etc., and the y-axis is marked similarly. The curve intersects the x-axis multiple times and has noticeable peaks and valleys.
**Use the graph to answer the following questions.**
(a) Over which intervals is the function increasing? Choose all that apply.
- \((-∞, -2)\)
- \((-2, 0)\)
- \((0, 3)\)
- \((3, 5)\)
- \((3, 7)\)
- \((7, ∞)\)
(b) At which x-values does the function have local minima? If there is more than one value, separate them with commas.
(c) What is the sign of the function's leading coefficient?
- (Choose one)
(d) Which of the following is a possibility for the degree of the function? Choose all that apply.
- 4
- 5
- 6
- 7
- 8
- 9
[Options for submitting answers and navigation buttons are present below the questions.]
© 2021 McGraw Hill LLC. All Rights Reserved.](/v2/_next/image?url=https%3A%2F%2Fcontent.bartleby.com%2Fqna-images%2Fquestion%2F90b823f6-a59b-43f1-924e-a48b4e93719a%2F86c1e997-43d9-4fc2-81d1-126de280695c%2Fw69yzpq_processed.jpeg&w=3840&q=75)
Transcribed Image Text:**Objective Knowledge Check**
**Question 4**
Below is the graph of a polynomial function with real coefficients. All local extrema of the function are shown in the graph.
[Graph of a polynomial]
**Description of the Graph:**
The graph shows a polynomial curve with fluctuations, having local maxima and minima. The x-axis is marked at intervals with values such as -6, -4, -2, 0, 2, 4, 6, etc., and the y-axis is marked similarly. The curve intersects the x-axis multiple times and has noticeable peaks and valleys.
**Use the graph to answer the following questions.**
(a) Over which intervals is the function increasing? Choose all that apply.
- \((-∞, -2)\)
- \((-2, 0)\)
- \((0, 3)\)
- \((3, 5)\)
- \((3, 7)\)
- \((7, ∞)\)
(b) At which x-values does the function have local minima? If there is more than one value, separate them with commas.
(c) What is the sign of the function's leading coefficient?
- (Choose one)
(d) Which of the following is a possibility for the degree of the function? Choose all that apply.
- 4
- 5
- 6
- 7
- 8
- 9
[Options for submitting answers and navigation buttons are present below the questions.]
© 2021 McGraw Hill LLC. All Rights Reserved.
Expert Solution
Step 1
Consider the given graph as,

Step by step
Solved in 3 steps with 1 images

Recommended textbooks for you
Advanced Engineering Mathematics
Advanced Math
ISBN:
9780470458365
Author:
Erwin Kreyszig
Publisher:
Wiley, John & Sons, Incorporated

Numerical Methods for Engineers
Advanced Math
ISBN:
9780073397924
Author:
Steven C. Chapra Dr., Raymond P. Canale
Publisher:
McGraw-Hill Education

Introductory Mathematics for Engineering Applicat…
Advanced Math
ISBN:
9781118141809
Author:
Nathan Klingbeil
Publisher:
WILEY
Advanced Engineering Mathematics
Advanced Math
ISBN:
9780470458365
Author:
Erwin Kreyszig
Publisher:
Wiley, John & Sons, Incorporated
Numerical Methods for Engineers
Advanced Math
ISBN:
9780073397924
Author:
Steven C. Chapra Dr., Raymond P. Canale
Publisher:
McGraw-Hill Education
Introductory Mathematics for Engineering Applicat…
Advanced Math
ISBN:
9781118141809
Author:
Nathan Klingbeil
Publisher:
WILEY

Mathematics For Machine Technology
Advanced Math
ISBN:
9781337798310
Author:
Peterson, John.
Publisher:
Cengage Learning,

