Use the following raw scores to answer the questions below. 29 21 19 29 20 28 28 29 32 29 15 2 . Using excel, make a histogram of the scores and paste it below. Your intervals should be set to 11-15, 16-20, 21-25, 26-30, and 31-35. 3. Using Excel, what is the skewness value? 4. According to the skewness value, is the distribution positively skewed, negatively skewed, or not skewed? _________________ 5. Using Excel, find the percentile rank of the second and third raw scores (21 & 19) in the list above. Then, interpret using words the meaning of these percentile ranks. 21 = ______% title ________________________________________________


- Use the following raw scores to answer the questions below.
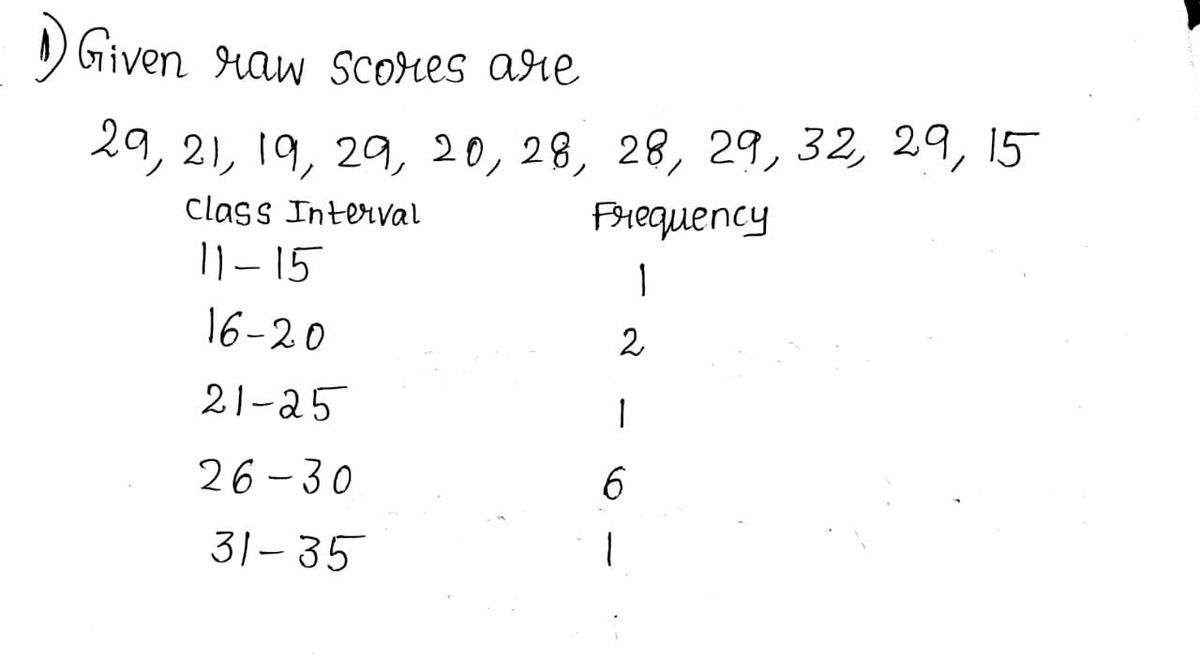
29 21 19 29 20 28 28 29 32 29 15
2 . Using excel, make a histogram of the scores and paste it below. Your intervals should be set to 11-15, 16-20, 21-25, 26-30, and 31-35.
3. Using Excel, what is the skewness value?
4. According to the skewness value, is the distribution positively skewed, negatively skewed, or not skewed? _________________
5. Using Excel, find the percentile rank of the second and third raw scores (21 & 19) in the list above. Then, interpret using words the meaning of these percentile ranks.
21 = ______% title ________________________________________________
Please note that as per our guidelines if the question is a subparts question we can answer the first three subparts only. Please repost the remaining separately to get the answers. Thank you.

Step by step
Solved in 4 steps with 7 images


