Use the accompanying graph to answer the following questions. Assume the company makes 83,000 parts per month of Product A and 39,000 parts per month of Product B. Click the icon to view the provided graph. (a) Which Product has the higher variable cost, and what is this value in units of dollars per part? Product B has the higher variable cost. This value is $.50 /part. (Type an integer or a decimal. Round y (b) Which Product has the higher selling price, and what is this value in units of dollars per part? Product B has the higher selling price. This value is $ 1.69 /part. (Type an integer or a decimal. Round (c) Which Product has the faster breakeven time, and what is this value in units of months? Product B has the faster breakeven time. This value is 22 month(s). (Type a whole number.) (d) At 6 years, which Product makes more profit and what is this value in units of dollars? At 6 years Product A makes more profit. This value is $4,850,000 (Type a whole number.) More Info Total Cost or Revenue [$] Milions $6- $5 $4 $3 Product A Total Cost Product B Total Cost Product A Revenue Product B Revenue
Use the accompanying graph to answer the following questions. Assume the company makes 83,000 parts per month of Product A and 39,000 parts per month of Product B. Click the icon to view the provided graph. (a) Which Product has the higher variable cost, and what is this value in units of dollars per part? Product B has the higher variable cost. This value is $.50 /part. (Type an integer or a decimal. Round y (b) Which Product has the higher selling price, and what is this value in units of dollars per part? Product B has the higher selling price. This value is $ 1.69 /part. (Type an integer or a decimal. Round (c) Which Product has the faster breakeven time, and what is this value in units of months? Product B has the faster breakeven time. This value is 22 month(s). (Type a whole number.) (d) At 6 years, which Product makes more profit and what is this value in units of dollars? At 6 years Product A makes more profit. This value is $4,850,000 (Type a whole number.) More Info Total Cost or Revenue [$] Milions $6- $5 $4 $3 Product A Total Cost Product B Total Cost Product A Revenue Product B Revenue

Chapter1: Making Economics Decisions
Section: Chapter Questions
Problem 1QTC

Related questions
Question

Transcribed Image Text:**Educational Website Content: Analyzing Product Cost and Revenue Data**
To analyze the cost and revenue of different products, consider the following questions and use the accompanying graph for reference. The company produces 83,000 parts of Product A and 39,000 parts of Product B monthly.
---
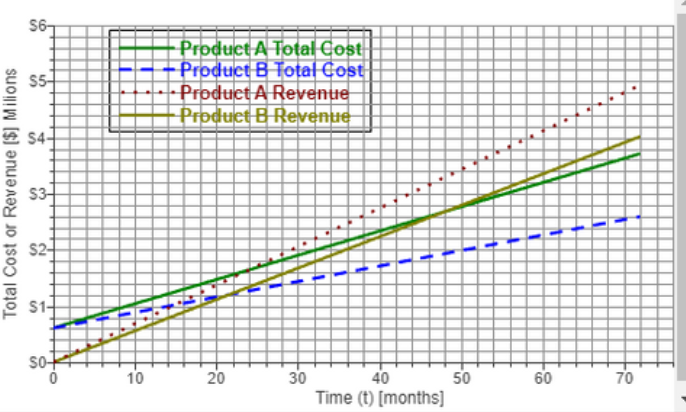
**Graph Analysis:**
The graph titled "More Info" provides a visual representation of both total cost and revenue over time for two products, A and B.
- **Axes:**
- The x-axis represents Time (t) in months.
- The y-axis captures Total Cost or Revenue in millions of dollars.
- **Lines on the Graph:**
- The **solid green line** depicts Product A’s Total Cost.
- The **dashed blue line** represents Product B’s Total Cost.
- The **dotted red line** illustrates Product A’s Revenue.
- The **dashed red line** shows Product B’s Revenue.
The intersection of cost and revenue lines indicates the breakeven point.
---
**Questions:**
**(a) Which Product has the higher variable cost, and what is this value in dollars per part?**
- Product B has the higher variable cost, which is $0.50 per part.
**(b) Which Product has the higher selling price, and what is this value in dollars per part?**
- Product B has the higher selling price, which is $1.69 per part.
**(c) Which Product has the faster breakeven time, and what is this value in months?**
- Product B reaches breakeven faster, in 22 months.
**(d) At 6 years, which Product makes more profit and what is this value in dollars?**
- At 6 years, Product A generates more profit, amounting to $4,850,000.
---
This analysis helps understand the comparative financial performance of products to aid in strategic decision-making.
Expert Solution
Given:

Step by step
Solved in 4 steps with 4 images

Knowledge Booster


Learn more about
Need a deep-dive on the concept behind this application? Look no further. Learn more about this topic, economics and related others by exploring similar questions and additional content below.Recommended textbooks for you

Principles of Economics (12th Edition)
Economics
ISBN:
9780134078779
Author:
Karl E. Case, Ray C. Fair, Sharon E. Oster
Publisher:
PEARSON

Engineering Economy (17th Edition)
Economics
ISBN:
9780134870069
Author:
William G. Sullivan, Elin M. Wicks, C. Patrick Koelling
Publisher:
PEARSON
Principles of Economics (12th Edition)
Economics
ISBN:
9780134078779
Author:
Karl E. Case, Ray C. Fair, Sharon E. Oster
Publisher:
PEARSON
Engineering Economy (17th Edition)
Economics
ISBN:
9780134870069
Author:
William G. Sullivan, Elin M. Wicks, C. Patrick Koelling
Publisher:
PEARSON

Principles of Economics (MindTap Course List)
Economics
ISBN:
9781305585126
Author:
N. Gregory Mankiw
Publisher:
Cengage Learning

Managerial Economics: A Problem Solving Approach
Economics
ISBN:
9781337106665
Author:
Luke M. Froeb, Brian T. McCann, Michael R. Ward, Mike Shor
Publisher:
Cengage Learning

Managerial Economics & Business Strategy (Mcgraw-…
Economics
ISBN:
9781259290619
Author:
Michael Baye, Jeff Prince
Publisher:
McGraw-Hill Education