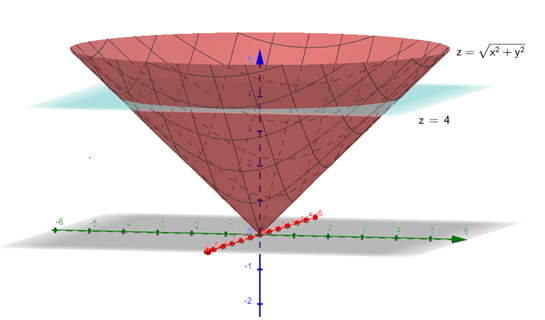
Use spherical coordinates to find the mass of the conical solid by the following graphs z-V+y and z-4 The density is given by the expression


Contingency Table
A contingency table can be defined as the visual representation of the relationship between two or more categorical variables that can be evaluated and registered. It is a categorical version of the scatterplot, which is used to investigate the linear relationship between two variables. A contingency table is indeed a type of frequency distribution table that displays two variables at the same time.
Binomial Distribution
Binomial is an algebraic expression of the sum or the difference of two terms. Before knowing about binomial distribution, we must know about the binomial theorem.
Business calc 3 question

The figure of the conical solid E is given below.
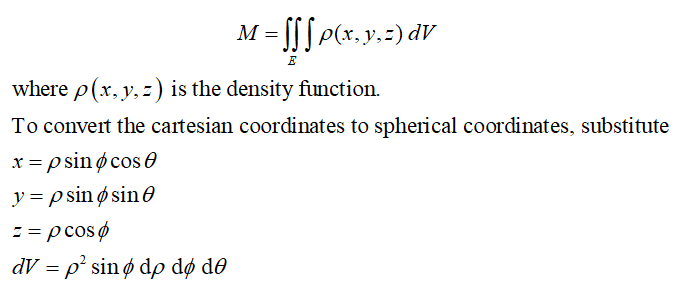
The formula for finding the mass of the conical solid is
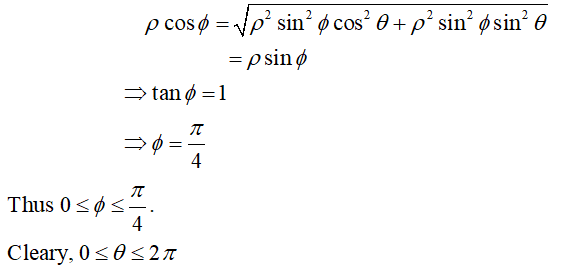
To find the limit of the coordinates.
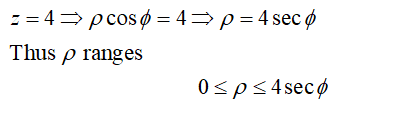
From the equation of the cone,

Step by step
Solved in 7 steps with 7 images


