Use eight intervals, starting with 0-19. Perform the following. a. Group the data as indicated. b. Prepare a frequency distribution with a column for intervals and frequencies. c. Construct a histogram. d. Construct a frequency polygon.
Use eight intervals, starting with 0-19. Perform the following. a. Group the data as indicated. b. Prepare a frequency distribution with a column for intervals and frequencies. c. Construct a histogram. d. Construct a frequency polygon.

Algebra and Trigonometry (6th Edition)
6th Edition
ISBN:9780134463216
Author:Robert F. Blitzer
Publisher:Robert F. Blitzer
ChapterP: Prerequisites: Fundamental Concepts Of Algebra
Section: Chapter Questions
Problem 1MCCP: In Exercises 1-25, simplify the given expression or perform the indicated operation (and simplify,...

Related questions
Question
100%

Transcribed Image Text:Use eight intervals, starting with 0-19. Perform the following.
a. Group the data as indicated.
b. Prepare a frequency distribution with a column for intervals and frequencies.
c. Construct a histogram.
d. Construct a frequency polygon.
13 106 115
71 127
26
27 44 127
81
55 137
44
71 63 142 76 73
123
12 44
35
85
81
2 98
84
96 91 37
86 145 33
82 12 101
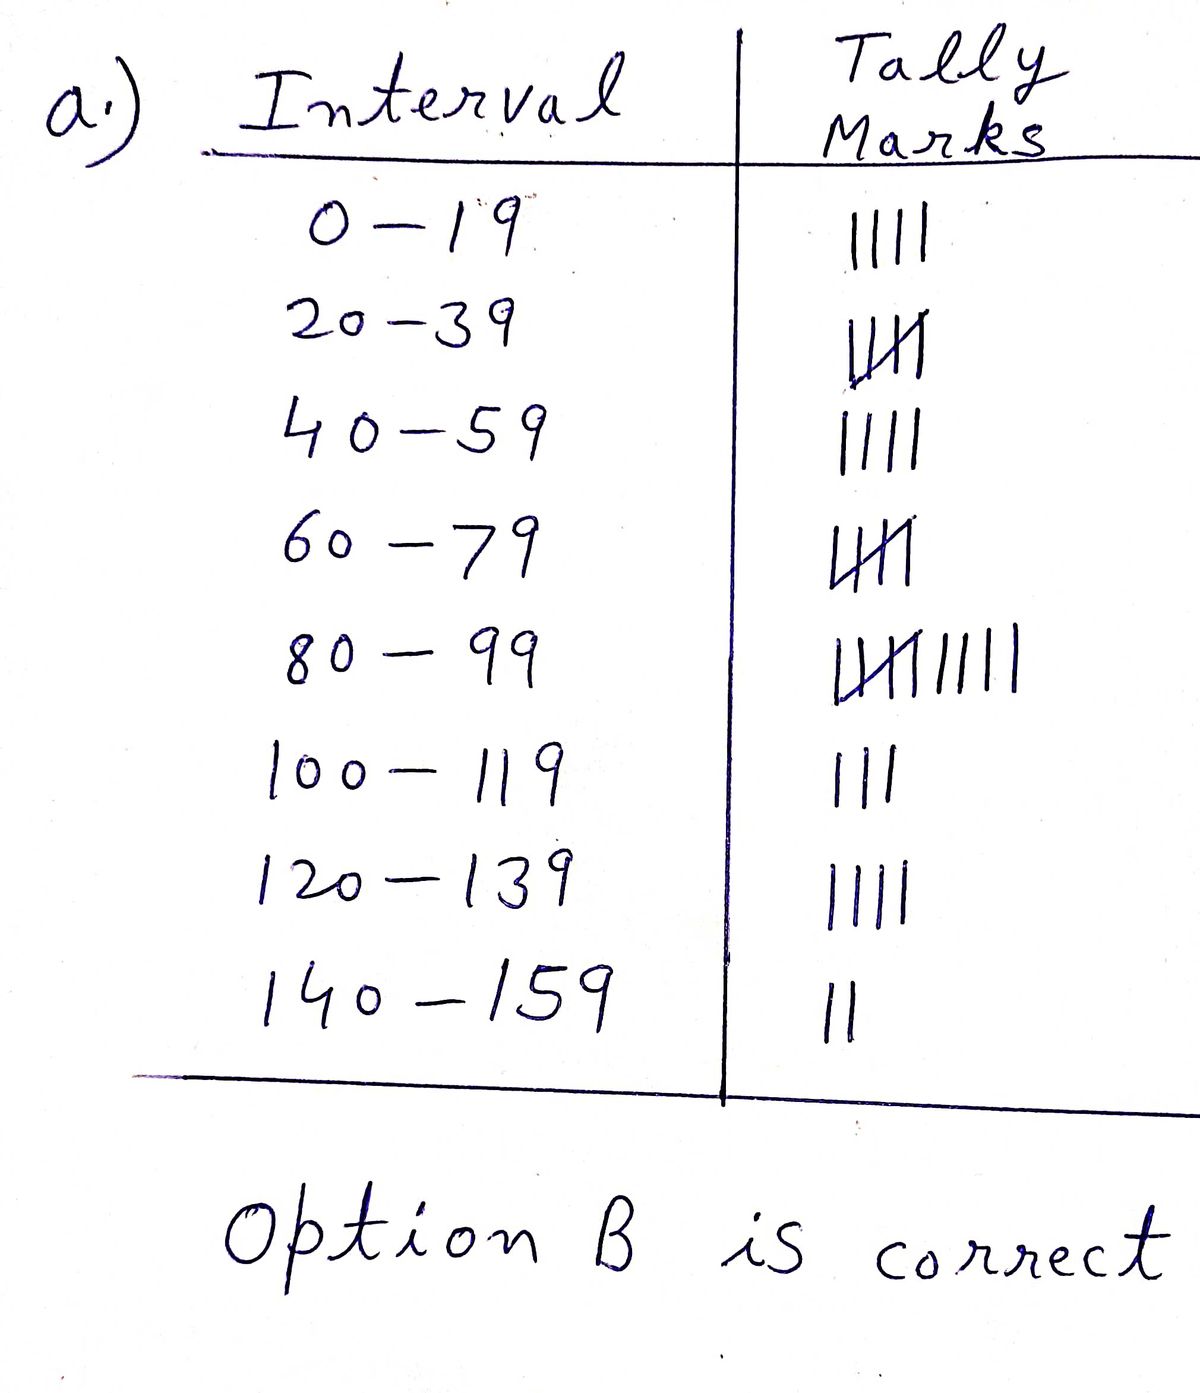
a. Tally the given data falling into each interval. Choose the correct table below.
O A.
0-19 I
20-39 uI
40-59 HII
60–79 HII
80-99 uI
100–119 H|
120-139 I
140–159 I|||
Interval
Tally
OB.
Interval
Tally
OC.
Interval
Tally
0-19
0-19
20-39 |II
40-59 HI
60–79 |
80-99 |I
100–119 |III
120–139 ||
20-39
40-59
60-79
80-99
100–119 |||
120-139 ||||
140–159 ||
140–159
Expert Solution
Step 1

Trending now
This is a popular solution!

Step by step
Solved in 4 steps with 4 images

Recommended textbooks for you
Algebra and Trigonometry (6th Edition)
Algebra
ISBN:
9780134463216
Author:
Robert F. Blitzer
Publisher:
PEARSON

Contemporary Abstract Algebra
Algebra
ISBN:
9781305657960
Author:
Joseph Gallian
Publisher:
Cengage Learning

Linear Algebra: A Modern Introduction
Algebra
ISBN:
9781285463247
Author:
David Poole
Publisher:
Cengage Learning
Algebra and Trigonometry (6th Edition)
Algebra
ISBN:
9780134463216
Author:
Robert F. Blitzer
Publisher:
PEARSON
Contemporary Abstract Algebra
Algebra
ISBN:
9781305657960
Author:
Joseph Gallian
Publisher:
Cengage Learning
Linear Algebra: A Modern Introduction
Algebra
ISBN:
9781285463247
Author:
David Poole
Publisher:
Cengage Learning

Algebra And Trigonometry (11th Edition)
Algebra
ISBN:
9780135163078
Author:
Michael Sullivan
Publisher:
PEARSON

Introduction to Linear Algebra, Fifth Edition
Algebra
ISBN:
9780980232776
Author:
Gilbert Strang
Publisher:
Wellesley-Cambridge Press

College Algebra (Collegiate Math)
Algebra
ISBN:
9780077836344
Author:
Julie Miller, Donna Gerken
Publisher:
McGraw-Hill Education