u wish to test the following claim (HaHa) at a significance level of α=0.02α=0.02. Ho:μ=55.8Ho:μ=55.8 Ha:μ>55.8Ha:μ>55.8 You believe the population is normally distributed, but you do not know the standard deviation. You obtain a sample of size n=29n=29 with a mean of M=68.4M=68.4 and a standard deviation of SD=18.3SD=18.3.


You wish to test the following claim (HaHa) at a significance level of α=0.02α=0.02.
Ho:μ=55.8Ho:μ=55.8
Ha:μ>55.8Ha:μ>55.8
You believe the population is
What is the critical value for this test?
***(Report answer accurate to three decimal places.)***
critical value =
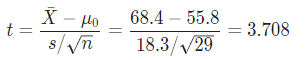
What is the test statistic for this sample?
**(Report answer accurate to three decimal places.)**
test statistic =
The test statistic is...
- in the critical region
- not in the critical region
This test statistic leads to a decision to...
- reject the null
- accept the null
- fail to reject the null
As such, the final conclusion is that...
- There is sufficient evidence to warrant rejection of the claim that the population mean is greater than 55.8.
- There is not sufficient evidence to warrant rejection of the claim that the population mean is greater than 55.8.
- The sample data support the claim that the population mean is greater than 55.8.
- There is not sufficient sample evidence to support the claim that the population mean is greater than 55.8.
Thank you!
As the population standard deviation is not known, we will use a t-test.
The null and alternative hypotheses are:
Ho: =
Ha: >
This corresponds to a right-tailed test.
The t-statistic is computed as follows:
Since it is observed that , the null hypothesis is rejected.
Since it is observed that , it is then concluded that the null hypothesis is rejected.

Trending now
This is a popular solution!

Step by step
Solved in 2 steps with 1 images


