Total-Mart Stores, Inc. Balance Sheet for Period Ending All numbers in thousands, LS Dollars. 31-Dec-19 31-Dec-18 31-Dec-17 Assets Cumrent Assets Cash And Cash Equivalents 7,395,000 7.907,000 7275,000 Short Term investments Net Receivables 5,089,000 4,144,000 3,905,000 Inventory 36,318,000 32.713,000 34,511,000 Other Current Assets 3,001,000 3.288,000 3.258,000 Total Current Assets 51,893,000 48.032,000 48,949,000 Property Plant and Equiement 107,878,000 102.307,000 95,653,000 Goodwil 16,763,000 16,126,000 15,260,000 Other Assets 4,128,000 3.942,000 3,567,000 Total Assets 180,663,000 170,407,000 163,420,000 Liabilities Cument Liabilies Accounts Payable 52,415,000 50.532,000 47,638,000 ShortiCumrent Long-Term Debt 6,022,000 4919,000 7,669,000 Other Cument Liabities 47,000 2,000 83,000 Total Current Liabilies 58,484,000 55,543,000 55,390,000 Long Tem Dett 43,842,000 36,401,000 34,540,000 Defersed Long Tem Liatily Charges 6,682,000 5.508,000 6,014,000 Minarity Interest Total Liabilities 2,705,000 2.180,000 1,794,000 111,713,090 99,632,000 97,747,000 Stockhelders' Equity Mise Stocks Options Warants 408,000 307,000 307,000 Common Stock 352,000 378,000 303,000 Retained Eamings 63,967,000 66.357,000 63,660,000 Capital Surplus 3,577,000 3.803,000 3,920,000 Other Stockholder Equty Total Stockholder Equity 646,000 -70,000 -2,688,000 68,542,000 70.468,000 65,285,000 Total Liabilities & Owners Equity 180,663,000 170,407,000 163,429,000 Currency in USD. 31-Dec-19 31-Dec-18 31-Dec-17 Period Ending 408,085,000 404,254,000 303,941,000 Total Revenue 421,343,000 Cost of Revenue 315,287,000 304,444,000 Gross Profit 106,562,000 103,641,000 100,313.000 Operating Expenses Seling General and Administrative (induding Depreciaion Expense 81,020,000 79,630.000 7,546.000 Operating Income er Loss Total Other Income/Expenses Net 25,542,000 24,002.000 22,747,000 201,000 181,000 284.000 Earnings Before Interest and Taxes 25,743,000 24,183.000 23,051.000 Interest Experse 2,205,000 2,005.000 2,184.000 Income Before Tax Income Tax Experse 23,538,000 22,118.000 20,867,000 7.579,000 7,156.000 513,000 14,962.000 7,133.000 Minority Interest 604,000 499,000 Net Income From Continuing Ops 15,959,000 13,734,000 Non-recurring Events Disconinued Operations 1.034,000 -79,000 146,000 Net Income 16,389,000 14,370.000 13,381.000 Net Income Applicable To Common Shares 16,389,000 14,370.000 13,381,000 Trading Information-Total-Mart Stores Inc. 04/30/2020 Current Stock price (04/30/2020) Beta: Shares Cutstarding Estimated growith rate in earnings (2 years). Equity Market risk premium (long term) $54.58 0.44 3.516Billion 9.90% 6.20%

Essentials Of Investments
11th Edition
ISBN:9781260013924
Author:Bodie, Zvi, Kane, Alex, MARCUS, Alan J.
Publisher:Bodie, Zvi, Kane, Alex, MARCUS, Alan J.
Chapter1: Investments: Background And Issues
Section: Chapter Questions
Problem 1PS
icon
Related questions
icon
Concept explainers
Topic Video
Question

QUESTION:

Find WACC (discount rate)

Additional Info:

 Analysts expect the firm’s revenues, earnings, capital expenditures, and depreciation to grow at 9.9% a year from 2019 to 2021, after which time the growth rate is expected to drop to 3%.

 The depreciation expense for 2019 is $5.182 billion.

 Capital spending is expected to offset depreciation in the stable state period.

 The yield on 30-year treasury bonds is 2% and the equity market risk premium is 6.2%.

The shares outstanding as of 12/31/2019 were 3,516,000,000 and the stock price was $60 per share.

 The average price of the company’s long-term corporate Bonds was 123.95 with an average yield to maturity of 4.16%. The company’s long-term bonds have a bond rating of AA.


Shares Outstanding                 3,516,000,000
Stock Price $60
Yield (30Y Treasury) 2%
Equity Market Risk Prem. 6.2%
Avg. Price LT Corp. Bond 123.95
Avg. YTM 4.16%
Depreciation Expense (2019) 5,182,000,000
Current Stock Price  54.58
Beta 0.44
Shares Outstanding                 3,516,000,000
Estimated Growth Rate in Earnings (2Y) 9.9
Equity Market Risk Prem. 6.2%
Total-Mart Stores, Inc. Balance Sheet for
Period Ending
All numbers in thousands, LS Dollars.
31-Dec-19
31-Dec-18
31-Dec-17
Assets
Cumrent Assets
Cash And Cash Equivalents
7,395,000
7.907,000
7275,000
Short Term investments
Net Receivables
5,089,000
4,144,000
3,905,000
Inventory
36,318,000
32.713,000
34,511,000
Other Current Assets
3,001,000
3.288,000
3.258,000
Total Current Assets
51,893,000
48.032,000
48,949,000
Property Plant and Equiement
107,878,000 102.307,000
95,653,000
Goodwil
16,763,000
16,126,000
15,260,000
Other Assets
4,128,000
3.942,000
3,567,000
Total Assets
180,663,000 170,407,000
163,420,000
Liabilities
Cument Liabilies
Accounts Payable
52,415,000
50.532,000
47,638,000
ShortiCumrent Long-Term Debt
6,022,000
4919,000
7,669,000
Other Cument Liabities
47,000
2,000
83,000
Total Current Liabilies
58,484,000
55,543,000
55,390,000
Long Tem Dett
43,842,000
36,401,000
34,540,000
Defersed Long Tem Liatily Charges
6,682,000
5.508,000
6,014,000
Minarity Interest
Total Liabilities
2,705,000
2.180,000
1,794,000
111,713,090
99,632,000
97,747,000
Stockhelders' Equity
Mise Stocks Options Warants
408,000
307,000
307,000
Common Stock
352,000
378,000
303,000
Retained Eamings
63,967,000
66.357,000
63,660,000
Capital Surplus
3,577,000
3.803,000
3,920,000
Other Stockholder Equty
Total Stockholder Equity
646,000
-70,000
-2,688,000
68,542,000
70.468,000
65,285,000
Total Liabilities & Owners Equity
180,663,000 170,407,000
163,429,000
Currency in USD.
Transcribed Image Text:Total-Mart Stores, Inc. Balance Sheet for Period Ending All numbers in thousands, LS Dollars. 31-Dec-19 31-Dec-18 31-Dec-17 Assets Cumrent Assets Cash And Cash Equivalents 7,395,000 7.907,000 7275,000 Short Term investments Net Receivables 5,089,000 4,144,000 3,905,000 Inventory 36,318,000 32.713,000 34,511,000 Other Current Assets 3,001,000 3.288,000 3.258,000 Total Current Assets 51,893,000 48.032,000 48,949,000 Property Plant and Equiement 107,878,000 102.307,000 95,653,000 Goodwil 16,763,000 16,126,000 15,260,000 Other Assets 4,128,000 3.942,000 3,567,000 Total Assets 180,663,000 170,407,000 163,420,000 Liabilities Cument Liabilies Accounts Payable 52,415,000 50.532,000 47,638,000 ShortiCumrent Long-Term Debt 6,022,000 4919,000 7,669,000 Other Cument Liabities 47,000 2,000 83,000 Total Current Liabilies 58,484,000 55,543,000 55,390,000 Long Tem Dett 43,842,000 36,401,000 34,540,000 Defersed Long Tem Liatily Charges 6,682,000 5.508,000 6,014,000 Minarity Interest Total Liabilities 2,705,000 2.180,000 1,794,000 111,713,090 99,632,000 97,747,000 Stockhelders' Equity Mise Stocks Options Warants 408,000 307,000 307,000 Common Stock 352,000 378,000 303,000 Retained Eamings 63,967,000 66.357,000 63,660,000 Capital Surplus 3,577,000 3.803,000 3,920,000 Other Stockholder Equty Total Stockholder Equity 646,000 -70,000 -2,688,000 68,542,000 70.468,000 65,285,000 Total Liabilities & Owners Equity 180,663,000 170,407,000 163,429,000 Currency in USD.
31-Dec-19
31-Dec-18
31-Dec-17
Period Ending
408,085,000
404,254,000
303,941,000
Total Revenue
421,343,000
Cost of Revenue
315,287,000
304,444,000
Gross Profit
106,562,000
103,641,000
100,313.000
Operating Expenses
Seling General and Administrative (induding
Depreciaion Expense
81,020,000
79,630.000
7,546.000
Operating Income er Loss
Total Other Income/Expenses Net
25,542,000
24,002.000
22,747,000
201,000
181,000
284.000
Earnings Before Interest and Taxes
25,743,000
24,183.000
23,051.000
Interest Experse
2,205,000
2,005.000
2,184.000
Income Before Tax
Income Tax Experse
23,538,000
22,118.000
20,867,000
7.579,000
7,156.000
513,000
14,962.000
7,133.000
Minority Interest
604,000
499,000
Net Income From Continuing Ops
15,959,000
13,734,000
Non-recurring Events
Disconinued Operations
1.034,000
-79,000
146,000
Net Income
16,389,000
14,370.000
13,381.000
Net Income Applicable To Common Shares
16,389,000
14,370.000
13,381,000
Trading Information-Total-Mart Stores Inc. 04/30/2020
Current Stock price (04/30/2020)
Beta:
Shares Cutstarding
Estimated growith rate in earnings (2
years).
Equity Market risk premium (long term)
$54.58
0.44
3.516Billion
9.90%
6.20%
Transcribed Image Text:31-Dec-19 31-Dec-18 31-Dec-17 Period Ending 408,085,000 404,254,000 303,941,000 Total Revenue 421,343,000 Cost of Revenue 315,287,000 304,444,000 Gross Profit 106,562,000 103,641,000 100,313.000 Operating Expenses Seling General and Administrative (induding Depreciaion Expense 81,020,000 79,630.000 7,546.000 Operating Income er Loss Total Other Income/Expenses Net 25,542,000 24,002.000 22,747,000 201,000 181,000 284.000 Earnings Before Interest and Taxes 25,743,000 24,183.000 23,051.000 Interest Experse 2,205,000 2,005.000 2,184.000 Income Before Tax Income Tax Experse 23,538,000 22,118.000 20,867,000 7.579,000 7,156.000 513,000 14,962.000 7,133.000 Minority Interest 604,000 499,000 Net Income From Continuing Ops 15,959,000 13,734,000 Non-recurring Events Disconinued Operations 1.034,000 -79,000 146,000 Net Income 16,389,000 14,370.000 13,381.000 Net Income Applicable To Common Shares 16,389,000 14,370.000 13,381,000 Trading Information-Total-Mart Stores Inc. 04/30/2020 Current Stock price (04/30/2020) Beta: Shares Cutstarding Estimated growith rate in earnings (2 years). Equity Market risk premium (long term) $54.58 0.44 3.516Billion 9.90% 6.20%
Expert Solution
Step 1

Calculation of WACC is shown below:

Finance homework question answer, step 1, image 1

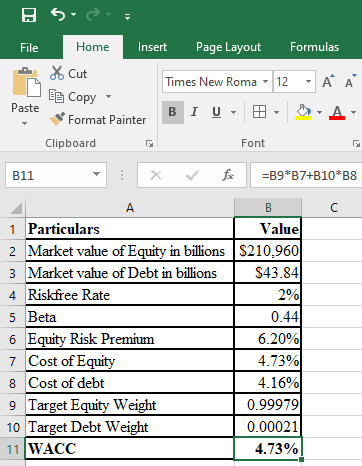
Hence, WACC is 4.73%

steps

Step by step

Solved in 2 steps with 2 images

Blurred answer
Knowledge Booster
Stock Valuation
Learn more about
Need a deep-dive on the concept behind this application? Look no further. Learn more about this topic, finance and related others by exploring similar questions and additional content below.
Similar questions
Recommended textbooks for you
Essentials Of Investments
Finance
ISBN:
9781260013924
Author:
Bodie, Zvi, Kane, Alex, MARCUS, Alan J.
Publisher:
Mcgraw-hill Education,
FUNDAMENTALS OF CORPORATE FINANCE
Finance
ISBN:
9781260013962
Author:
BREALEY
Publisher:
RENT MCG
Financial Management: Theory & Practice
Finance
ISBN:
9781337909730
Author:
Brigham
Publisher:
Cengage
Foundations Of Finance
Finance
ISBN:
9780134897264
Author:
KEOWN, Arthur J., Martin, John D., PETTY, J. William
Publisher:
Pearson,
Fundamentals of Financial Management (MindTap Cou…
Finance
ISBN:
9781337395250
Author:
Eugene F. Brigham, Joel F. Houston
Publisher:
Cengage Learning
Corporate Finance (The Mcgraw-hill/Irwin Series i…
Finance
ISBN:
9780077861759
Author:
Stephen A. Ross Franco Modigliani Professor of Financial Economics Professor, Randolph W Westerfield Robert R. Dockson Deans Chair in Bus. Admin., Jeffrey Jaffe, Bradford D Jordan Professor
Publisher:
McGraw-Hill Education