This would be the same as if population standard deviation was unknown and we were to use sample standard deviation, while n>30. Also in case n<30 and population standard deviation is known this formula is still valid given the underlying distribution of each sample observation is normal. c) Using item a) and the central limit theorem of sample proportion which is ~ N(0, 1) Vm/n Show that P(p – Za/2\ < p< p- %a/2 = 1- a Note that above is the confidence interval for population proportion; however, since it envolves the unkown population proportion p, sample proportion will be used instead. d) Where the students t distribution was discovered ? why it was called this way ? in what situation confidence intervals of population mean need to be made based on this distribution ? What was the application of it when it was discovered ? Which one is true: when its degree of freedom increases it diverges or converges to the normal distribution ?
This would be the same as if population standard deviation was unknown and we were to use sample standard deviation, while n>30. Also in case n<30 and population standard deviation is known this formula is still valid given the underlying distribution of each sample observation is normal. c) Using item a) and the central limit theorem of sample proportion which is ~ N(0, 1) Vm/n Show that P(p – Za/2\ < p< p- %a/2 = 1- a Note that above is the confidence interval for population proportion; however, since it envolves the unkown population proportion p, sample proportion will be used instead. d) Where the students t distribution was discovered ? why it was called this way ? in what situation confidence intervals of population mean need to be made based on this distribution ? What was the application of it when it was discovered ? Which one is true: when its degree of freedom increases it diverges or converges to the normal distribution ?

MATLAB: An Introduction with Applications
6th Edition
ISBN:9781119256830
Author:Amos Gilat
Publisher:Amos Gilat
Chapter1: Starting With Matlab
Section: Chapter Questions
Problem 1P

Related questions
Question
I am just needing help with part c and d

Transcribed Image Text:1. Construction of confidence intervals
a) Drawing picture show that if Z~N(0,1) (a random variable that is normally distributed with mean 0 and variance 1), then
P(-za/2 < Z < %a/2) = 1 – a
b) by Central limit theorem we know for n> 30 ;
X-H
Z =
~ N(0, 1)
plug in this Z in the formula of a) and show that
P(X – za/2"
Vn
<µ< X +%a/2)
= 1-a
Vn
Note that this is the formula for confidence interval of population mean when sample is large and population standard deviation is known.
This would be the same as if population standard deviation was unknown and we were to use sample standard deviation, while n>30.
Also in case n<30 and population standard deviation is known this formula is still valid given the underlying distribution of each sample observation is
normal.
TE
p– p
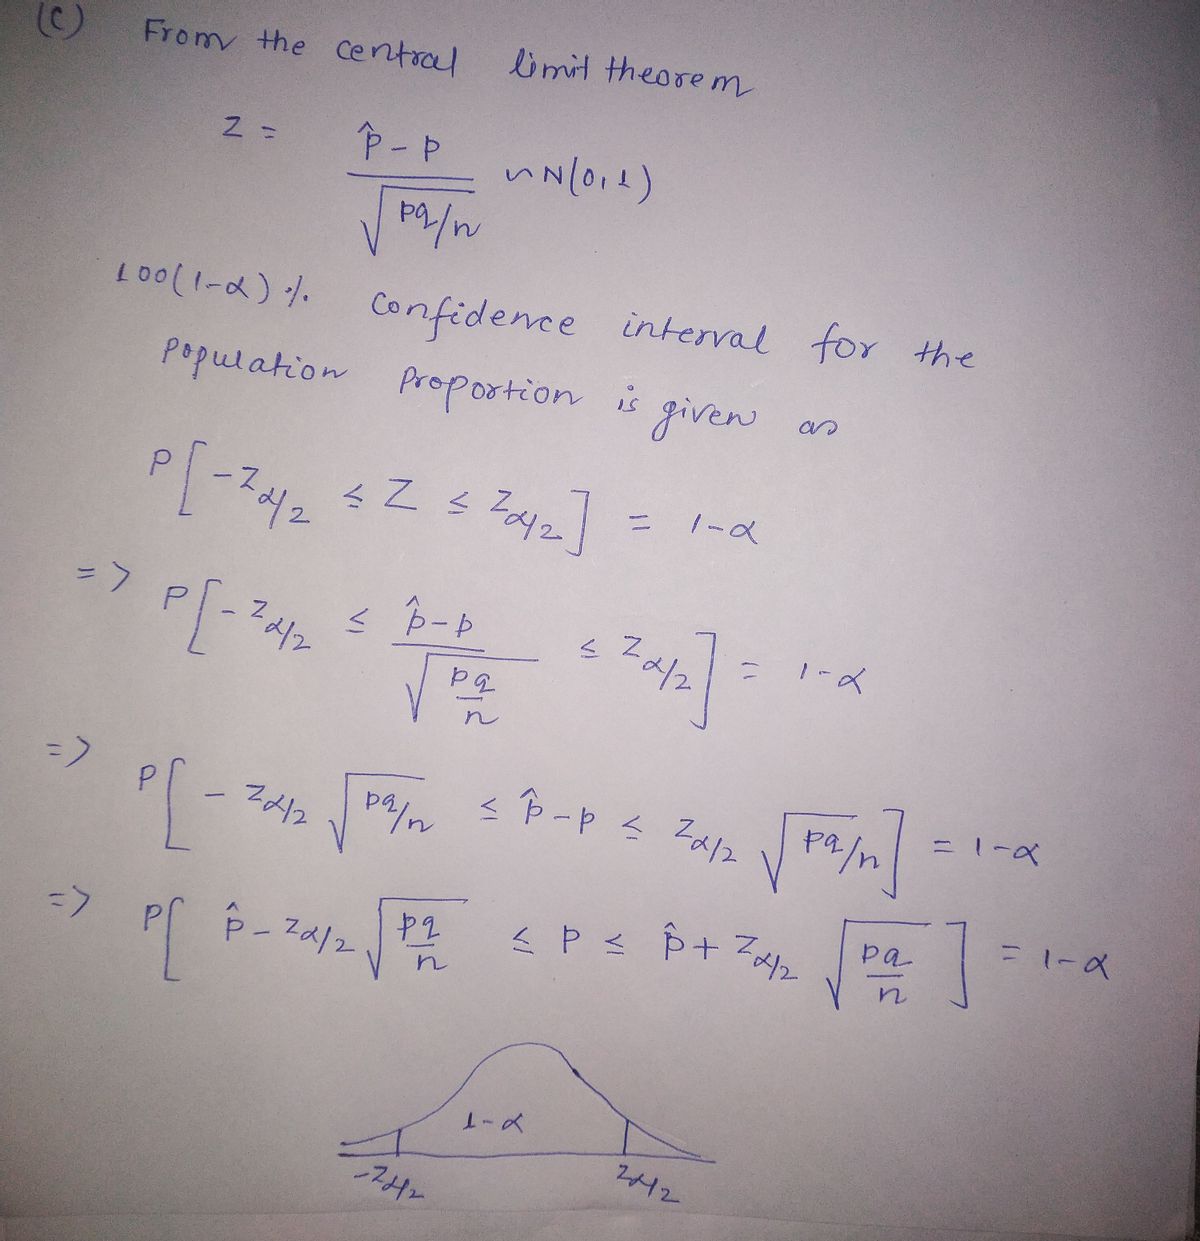
c) Using item a) and the central limit theorem of sample proportion which is
Show that
Z =
- N(0, 1)
P(p – 2
< p<p- Za/2
- Za/2\
= 1- a
n
Note that above is the confidence interval for population proportion; however, since it envolves the unkown population proportion p, sample
proportion will be used instead.
d) Where the students t distribution was discovered ? why it was called this way ? in what situation confidence intervals of population mean
need to be made based on this distribution ? What was the application of it when it was discovered ? Which one is true: when its degree of
freedom increases it diverges or converges to the normal distribution ?
Expert Solution
Step 1

Step by step
Solved in 3 steps with 3 images

Recommended textbooks for you
MATLAB: An Introduction with Applications
Statistics
ISBN:
9781119256830
Author:
Amos Gilat
Publisher:
John Wiley & Sons Inc

Probability and Statistics for Engineering and th…
Statistics
ISBN:
9781305251809
Author:
Jay L. Devore
Publisher:
Cengage Learning

Statistics for The Behavioral Sciences (MindTap C…
Statistics
ISBN:
9781305504912
Author:
Frederick J Gravetter, Larry B. Wallnau
Publisher:
Cengage Learning
MATLAB: An Introduction with Applications
Statistics
ISBN:
9781119256830
Author:
Amos Gilat
Publisher:
John Wiley & Sons Inc
Probability and Statistics for Engineering and th…
Statistics
ISBN:
9781305251809
Author:
Jay L. Devore
Publisher:
Cengage Learning
Statistics for The Behavioral Sciences (MindTap C…
Statistics
ISBN:
9781305504912
Author:
Frederick J Gravetter, Larry B. Wallnau
Publisher:
Cengage Learning

Elementary Statistics: Picturing the World (7th E…
Statistics
ISBN:
9780134683416
Author:
Ron Larson, Betsy Farber
Publisher:
PEARSON

The Basic Practice of Statistics
Statistics
ISBN:
9781319042578
Author:
David S. Moore, William I. Notz, Michael A. Fligner
Publisher:
W. H. Freeman

Introduction to the Practice of Statistics
Statistics
ISBN:
9781319013387
Author:
David S. Moore, George P. McCabe, Bruce A. Craig
Publisher:
W. H. Freeman