This question is not on any test. The table below shows the number of people for three different race groups who were shot by police that were either armed or unarmed. These values are very close to the exact numbers. They have been changed slightly for each student to get a unique problem. Race/Armed Suspect was Armed Suspect was unarmed Total Black 543 60 603 White 1176 67 1243 Hispanic 378 38 416 Total 2097 165 2262 Give your answer as a decimal to at least three decimal places. If you compare answers d, e and f it shows the highest percentage of unarmed people being shot is most likely white. Why is that? This is because there are more white people in the United States than any other race and therefore there are likely to be more white people in the table. Since there are more white people in the table, there most likely would be more white and unarmed people shot by police than any other race. This pulls the percentage of white and unarmed up. In addition, there most likely would be more white and armed shot by police. All the percentages for white people would be higher, because there are more white people. For example, the table contains very few Hispanic people, and the percentage of people in the table that were Hispanic and unarmed is the lowest percentage. Think of it this way. If you went to a college that was 90% female and 10% male, then females would most likely have the highest percentage of A grades. They would also most likely have the highest percentage of B, C, D and F grades The correct way to compare is "conditional probability". Conditional probability is getting the probability of something happening, given we are dealing with just the people in a particular group. g) What percent of blacks shot and killed by police were unarmed? h) What percent of whites shot and killed by police were unarmed? i) What percent of Hispanics shot and killed by police were unarmed? You can see by the answers to part g and h, that the percentage of blacks that were unarmed and killed by police is approximately twice that of whites that were unarmed and killed by police. j) Why do you believe this is happening? Do a search on the internet for reasons why blacks are more likely to be killed by police. Read a few articles on the topic. Write your response using the articles as references. Give the websites used in your response. Your answer should be several sentences long with at least one website listed. This part of this problem will be graded after the due date.


This question is not on any test.
The table below shows the number of people for three different race groups who were shot by police that were either armed or unarmed. These values are very close to the exact numbers. They have been changed slightly for each student to get a unique problem.
| Race/Armed | Suspect was Armed | Suspect was unarmed | Total |
| Black | 543 | 60 | 603 |
| White | 1176 | 67 | 1243 |
| Hispanic | 378 | 38 | 416 |
| Total | 2097 | 165 | 2262 |
Give your answer as a decimal to at least three decimal places.
If you compare answers d, e and f it shows the highest percentage of unarmed people being shot is most likely white.
Why is that?
This is because there are more white people in the United States than any other race and therefore there are likely to be more white people in the table. Since there are more white people in the table, there most likely would be more white and unarmed people shot by police than any other race. This pulls the percentage of white and unarmed up. In addition, there most likely would be more white and armed shot by police. All the percentages for white people would be higher, because there are more white people. For example, the table contains very few Hispanic people, and the percentage of people in the table that were Hispanic and unarmed is the lowest percentage.
Think of it this way. If you went to a college that was 90% female and 10% male, then females would most likely have the highest percentage of A grades. They would also most likely have the highest percentage of B, C, D and F grades
The correct way to compare is "conditional probability".
Conditional probability is getting the probability of something happening, given we are dealing with just the people in a particular group.
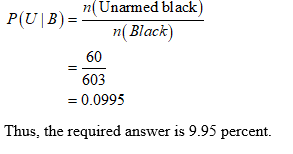
g) What percent of blacks shot and killed by police were unarmed?
h) What percent of whites shot and killed by police were unarmed?
i) What percent of Hispanics shot and killed by police were unarmed?
You can see by the answers to part g and h, that the percentage of blacks that were unarmed and killed by police is approximately twice that of whites that were unarmed and killed by police.
j) Why do you believe this is happening?
Do a search on the internet for reasons why blacks are more likely to be killed by police. Read a few articles on the topic. Write your response using the articles as references. Give the websites used in your response. Your answer should be several sentences long with at least one website listed. This part of this problem will be graded after the due date.
Since we only answer up to 3 sub-parts, we’ll answer the first 3. Please resubmit the question and specify the other subparts (up to 3) you’d like answered
The given table is:
|
Race/ Armed |
Suspect was Armed |
Suspect was unarmed |
Total |
|
Back |
543 |
60 |
603 |
|
White |
1176 |
67 |
1243 |
|
Hispanic |
378 |
38 |
416 |
|
Total |
2097 |
165 |
2262 |
g).
The percent of blacks shot and killed by police were unarmed, can be calculated as:

Trending now
This is a popular solution!

Step by step
Solved in 3 steps with 3 images


