The weights (in pounds) of 19 preschool children are 43, 25, 22, 39, 35, 42,

A First Course in Probability (10th Edition)
10th Edition
ISBN:9780134753119
Author:Sheldon Ross
Publisher:Sheldon Ross
Chapter1: Combinatorial Analysis
Section: Chapter Questions
Problem 1.1P: a. How many different 7-place license plates are possible if the first 2 places are for letters and...

Related questions
Question
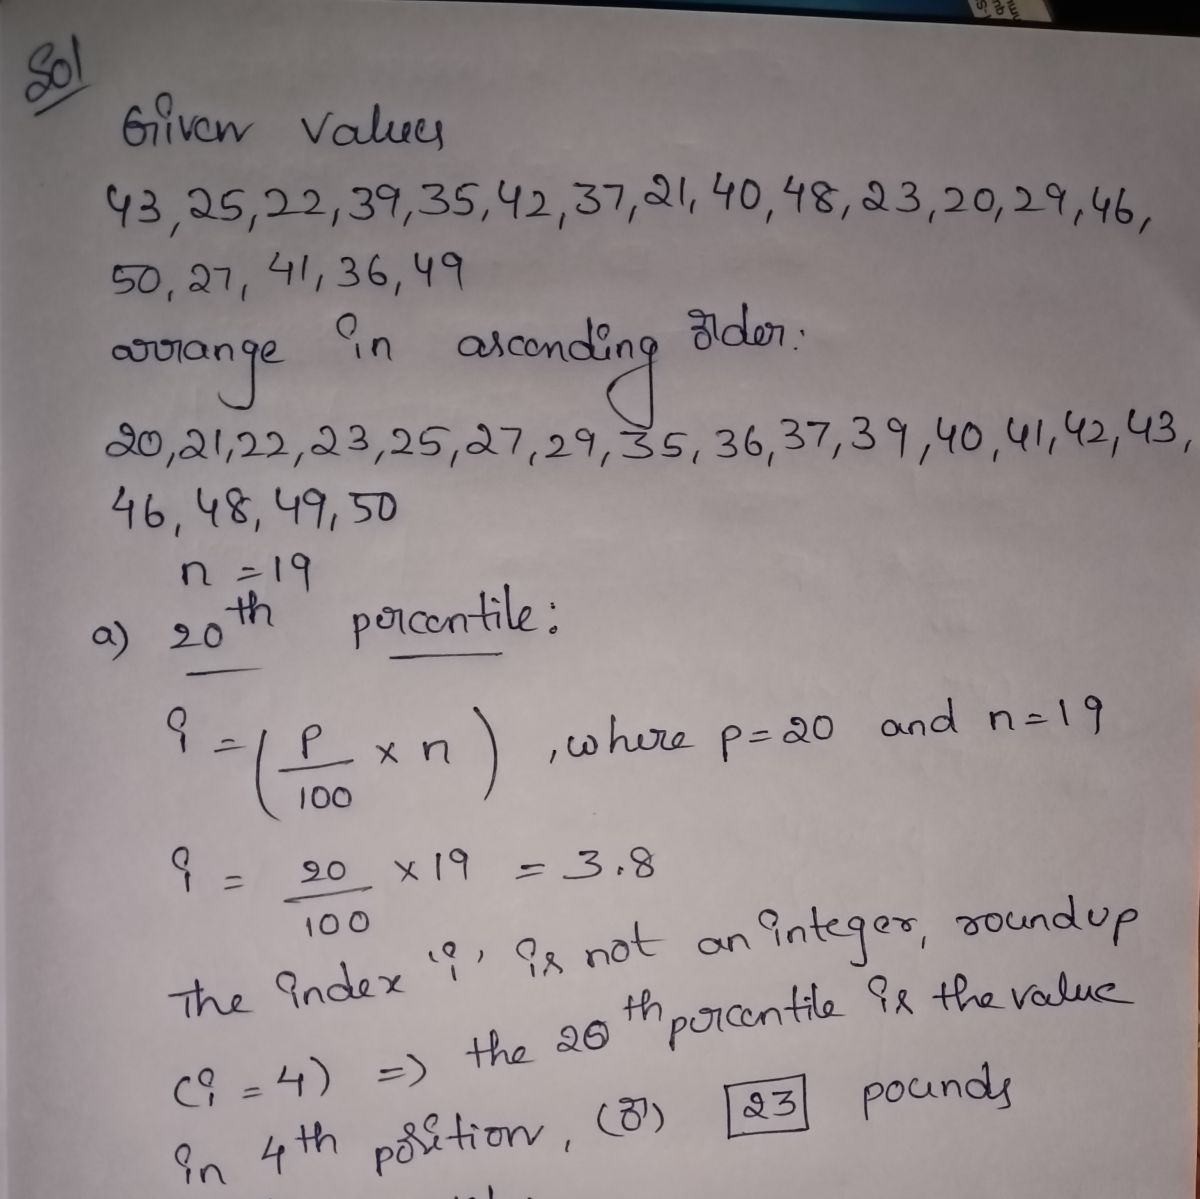
The weights (in pounds) of 19 preschool children are
43, 25, 22, 39, 35, 42, 37, 21, 40, 48, 23, 20, 29, 46, 50, 27, 41, 36, 49
Find 20th and 75th percentiles for these weights.
(a) The 20th percentile: pounds
(b) The 75th percentile: pounds
Expert Solution
Step 1

Step by step
Solved in 2 steps with 2 images

Recommended textbooks for you
A First Course in Probability (10th Edition)
Probability
ISBN:
9780134753119
Author:
Sheldon Ross
Publisher:
PEARSON

A First Course in Probability (10th Edition)
Probability
ISBN:
9780134753119
Author:
Sheldon Ross
Publisher:
PEARSON