The water conditions at 250 m fell within the ranges of temperature and salinity indentified as an __ mass. a. NACSW b. MIW c. NADW d. AAIW e. AABW
The water conditions at 250 m fell within the ranges of temperature and salinity indentified as an __ mass. a. NACSW b. MIW c. NADW d. AAIW e. AABW
Applications and Investigations in Earth Science (9th Edition)
9th Edition
ISBN:9780134746241
Author:Edward J. Tarbuck, Frederick K. Lutgens, Dennis G. Tasa
Publisher:Edward J. Tarbuck, Frederick K. Lutgens, Dennis G. Tasa
Chapter1: The Study Of Minerals
Section: Chapter Questions
Problem 1LR
Related questions
Question
100%
The water conditions at 250 m fell within the ranges of temperature and salinity indentified as an __ mass.
a. NACSW
b. MIW
c. NADW
d. AAIW
e. AABW
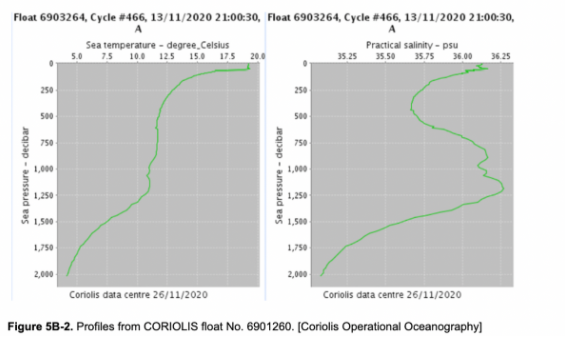
![Figure 5B-2 provides data collected from the CORIOLIS ARVOR profiler
#6903264 in the Atlantic Ocean. The left profile shows the change in temperature
(°C) with depth. The right profile shows the change in salinity (practical salinity
units) with depth. The data was collected on 13 November 2020. 1 decibar of water
pressure corresponds to 1 m of water depth.
Float 6903264, Cycle #466, 13/11/2020 21:00:30, Float 6903264, Cycle #466, 13/11/2020 2 1:00:30,
A
A
Sea temperature - degree_Celsius
Practical salinity - psu
5.0
7.5
10.0
12.5
15.0
17.5
20.0
35.25
35.50
35.75
36.00
36.25
250
250
500
500
750
750
1,000
1,000
1,250
1,250
1,500
1,500
1,750
1,750
2,000
2,000
Coriolis data centre 26/11/2020
Coriolis data centre 26/11/2020
Figure 5B-2. Profiles from CORIOLIS float No. 6901260. [Coriolis Operational Oceanography]
Sea pressure - decibar
Sea pressure - decibar](/v2/_next/image?url=https%3A%2F%2Fcontent.bartleby.com%2Fqna-images%2Fquestion%2F03b1462a-0e5a-4a37-baae-06e9953f8b62%2F44b48a3b-5788-4d47-b534-b97a2583f2a2%2Fvb60hv_processed.png&w=3840&q=75)
Transcribed Image Text:Figure 5B-2 provides data collected from the CORIOLIS ARVOR profiler
#6903264 in the Atlantic Ocean. The left profile shows the change in temperature
(°C) with depth. The right profile shows the change in salinity (practical salinity
units) with depth. The data was collected on 13 November 2020. 1 decibar of water
pressure corresponds to 1 m of water depth.
Float 6903264, Cycle #466, 13/11/2020 21:00:30, Float 6903264, Cycle #466, 13/11/2020 2 1:00:30,
A
A
Sea temperature - degree_Celsius
Practical salinity - psu
5.0
7.5
10.0
12.5
15.0
17.5
20.0
35.25
35.50
35.75
36.00
36.25
250
250
500
500
750
750
1,000
1,000
1,250
1,250
1,500
1,500
1,750
1,750
2,000
2,000
Coriolis data centre 26/11/2020
Coriolis data centre 26/11/2020
Figure 5B-2. Profiles from CORIOLIS float No. 6901260. [Coriolis Operational Oceanography]
Sea pressure - decibar
Sea pressure - decibar

Transcribed Image Text:The Temperature-Salinity (T-S) diagram in Figure 5B-3 shows the typical range of
temperature and salinity combinations in ocean water and the resulting density. The
T-S diagram is a simple but powerful tool used to understand water mass properties.
(Refer to Investigation 3A to review the T-S diagram and its interpretation.)
20
1.0245 g/cm
15
1.0250
1.0255
1.0260
NACSW
10
1.0265
1.0270,
MIW
5
1.0275
1.0280
AAIW
ONADW
1.0285
AABW
33.5
34.0
34.5
35.0
35.5
Salinity (psu)
36.0
36.5
Temperature (°C)
1.0290
Expert Solution
Step 1
Here there are the two graphs, in which one is showing the sea temperature and sea pressure variation. The pressure corresponds to water depth, so we can correlate the seawater temperature with the depth. Also, another graph explains the practical salinity variation with the pressure, also we can correlate with the depth.

Trending now
This is a popular solution!
Step by step
Solved in 3 steps with 2 images

Recommended textbooks for you

Applications and Investigations in Earth Science …
Earth Science
ISBN:
9780134746241
Author:
Edward J. Tarbuck, Frederick K. Lutgens, Dennis G. Tasa
Publisher:
PEARSON

Exercises for Weather & Climate (9th Edition)
Earth Science
ISBN:
9780134041360
Author:
Greg Carbone
Publisher:
PEARSON

Environmental Science
Earth Science
ISBN:
9781260153125
Author:
William P Cunningham Prof., Mary Ann Cunningham Professor
Publisher:
McGraw-Hill Education

Applications and Investigations in Earth Science …
Earth Science
ISBN:
9780134746241
Author:
Edward J. Tarbuck, Frederick K. Lutgens, Dennis G. Tasa
Publisher:
PEARSON

Exercises for Weather & Climate (9th Edition)
Earth Science
ISBN:
9780134041360
Author:
Greg Carbone
Publisher:
PEARSON

Environmental Science
Earth Science
ISBN:
9781260153125
Author:
William P Cunningham Prof., Mary Ann Cunningham Professor
Publisher:
McGraw-Hill Education

Earth Science (15th Edition)
Earth Science
ISBN:
9780134543536
Author:
Edward J. Tarbuck, Frederick K. Lutgens, Dennis G. Tasa
Publisher:
PEARSON

Environmental Science (MindTap Course List)
Earth Science
ISBN:
9781337569613
Author:
G. Tyler Miller, Scott Spoolman
Publisher:
Cengage Learning

Physical Geology
Earth Science
ISBN:
9781259916823
Author:
Plummer, Charles C., CARLSON, Diane H., Hammersley, Lisa
Publisher:
Mcgraw-hill Education,