The variability of oil prices per barrel has been very stable for the past 26 weeks. You would like to see if the variability of gas prices in San Diego has changed. The standard deviation of gas prices during periods of such stability has been 30 cents and it was thought that these prices were relatively normally distributed. You would like to see if they have changed so you randomly select 26 gas prices from this time period and get a sample standard deviation is 37.5 cents. At the level of significance of .05 see if gas prices variability has changed. Do the 5 step process to conduct a hypothesis test. Also at what critical value would you reject the null hypothesis?
The variability of oil prices per barrel has been very stable for the past 26 weeks. You would like to see if the variability of gas prices in San Diego has changed. The standard deviation of gas prices during periods of such stability has been 30 cents and it was thought that these prices were relatively
Do the 5 step process to conduct a hypothesis test.
Also at what critical value would you reject the null hypothesis?
State the hypotheses.

That is, there is no evidence that the gas prices variability has changed.

That is, there is evidence that the gas prices variability has changed.
Determine the level of significance.
Significance level:
In order to decide how small the p-value should be for providing convincing evidence against the null hypothesis, a value should be used. The value that is used as the rule or the criterion for deciding how small the p-value should be is called as level of significance.

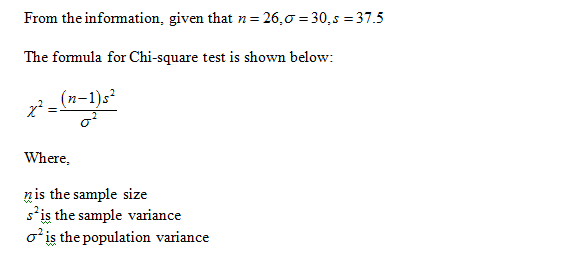
Obtain the value of the test statistic.
The value of the test statistic is obtained below:

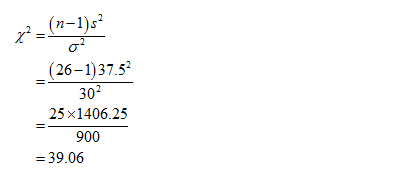
The required value is,

Thus, the value of the test statistic is 39.06.
Step by step
Solved in 6 steps with 7 images


