The table shows the location and number of floors in some of the tallest buildings in the world. Complete parts (a) through (c) below. IT City # Floors D City 1 167 City 2 119 City 3 112 City 4 City 5 101 101 a. Find, and interpret (report in context) the mean number of floors in this data set. Select the correct choice below and fill in the answer box within your choice. (Type an integer or a decimal. Do not round.) O A. The typical number of floors per city is O B. The typical number of floors in each tallest building is O C. The typical number of floors in each city is O D. The typical number of floors of the tallest buildings is Select the correct choice below and fill in the answer box within your choice. b. Find and interpret the standard deviation of the number of floors in this data set. Select the correct choice below and fill in the answer box V City 1. (Type an integer or decimal rounded to the nearest tenth as needed.) O A. The standard deviation of the number of floors in each city is City 3. O B. The standard deviation of the number of floors per city is City 5. O C. The standard deviation of the number of floors of the tallest buildings is City 4. O D. The standard deviation of the number of floors in each tallest building is City 2. c. Which of the given observations is farthest from the mean and therefore contributes most to the standard deviation? The number farthest from the mean that contributes the most to the given standard deviation is , which represents the number of floors in
The table shows the location and number of floors in some of the tallest buildings in the world. Complete parts (a) through (c) below. IT City # Floors D City 1 167 City 2 119 City 3 112 City 4 City 5 101 101 a. Find, and interpret (report in context) the mean number of floors in this data set. Select the correct choice below and fill in the answer box within your choice. (Type an integer or a decimal. Do not round.) O A. The typical number of floors per city is O B. The typical number of floors in each tallest building is O C. The typical number of floors in each city is O D. The typical number of floors of the tallest buildings is Select the correct choice below and fill in the answer box within your choice. b. Find and interpret the standard deviation of the number of floors in this data set. Select the correct choice below and fill in the answer box V City 1. (Type an integer or decimal rounded to the nearest tenth as needed.) O A. The standard deviation of the number of floors in each city is City 3. O B. The standard deviation of the number of floors per city is City 5. O C. The standard deviation of the number of floors of the tallest buildings is City 4. O D. The standard deviation of the number of floors in each tallest building is City 2. c. Which of the given observations is farthest from the mean and therefore contributes most to the standard deviation? The number farthest from the mean that contributes the most to the given standard deviation is , which represents the number of floors in

MATLAB: An Introduction with Applications
6th Edition
ISBN:9781119256830
Author:Amos Gilat
Publisher:Amos Gilat
Chapter1: Starting With Matlab
Section: Chapter Questions
Problem 1P

Related questions
Question
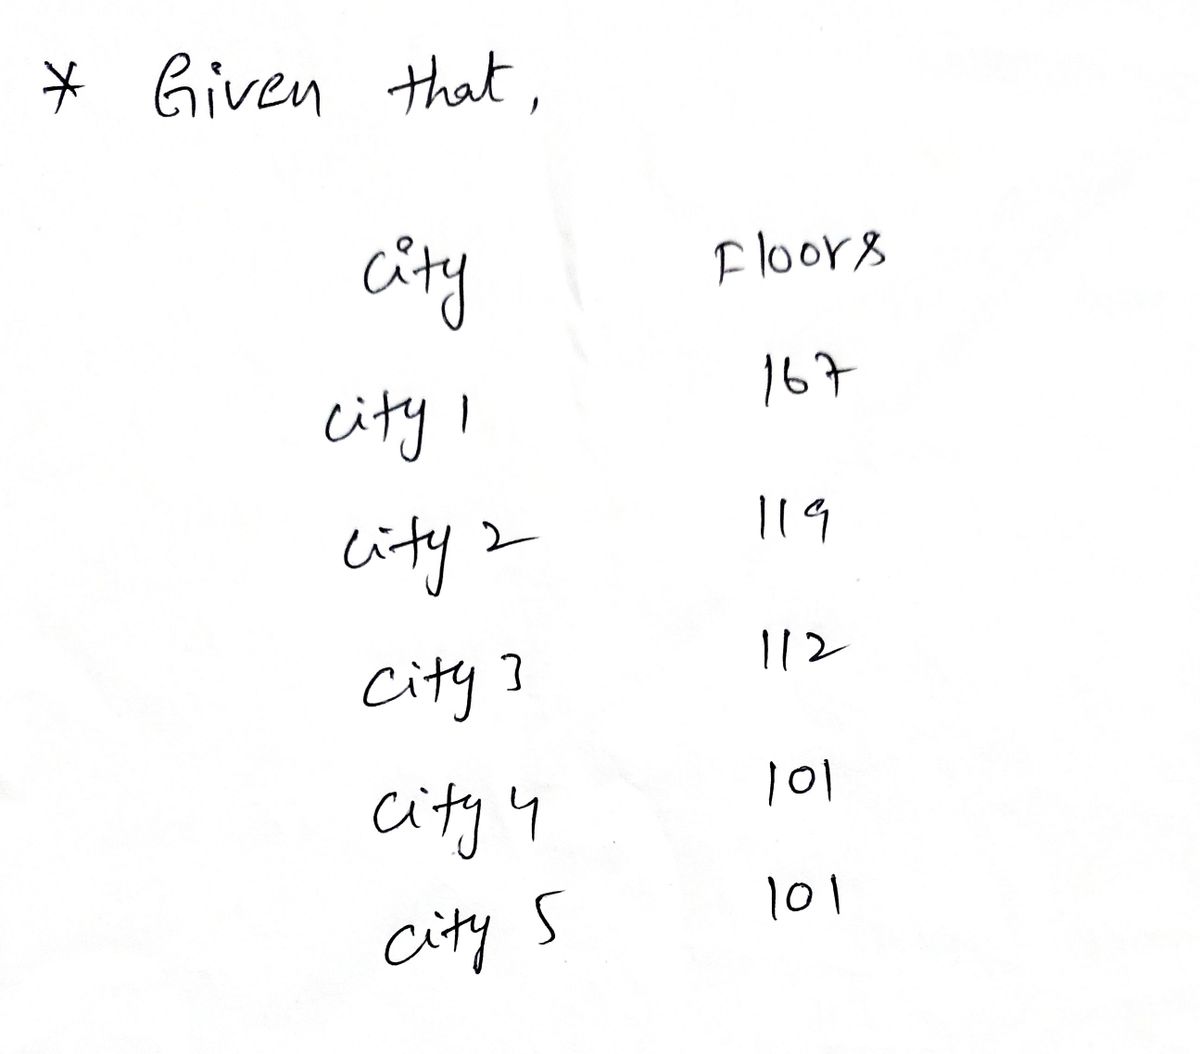
The table shows the location and number of floors in some of the tallest buildings in the world. Complete parts (a) through (c) below.

Transcribed Image Text:The table shows the location and number of floors in some of the tallest buildings in the world. Complete parts (a) through (c) below.
IT
City
# Floors
City 1
167
City 2
119
City 3
112
City 4
101
City 5
101
a. Find, and interpret (report in context) the mean number of floors in this data set. Select the correct choice below and fill in the answer box within your choice.
(Type an integer or a decimal. Do not round.)
O A. The typical number of floors per city is
B. The typical number of floors in each tallest building is
O C. The typical number of floors in each city is
O D. The typical number of floors of the tallest buildings is
Select the correct choice below and fill in the answer box within your choice.
b. Find and interpret the standard deviation of the number of floors in this data set. Select the correct choice below and fill in the answer bo v
(Type an integer or decimal rounded to the nearest tenth as needed.)
City 1.
O A. The standard deviation of the number of floors in each city is
City 3.
O B. The standard deviation of the number of floors per city is
City 5.
O C. The standard deviation of the number of floors of the tallest buildings is
City 4.
D. The standard deviation of the number of floors in each tallest building is
City 2.
c. Which of the given observations is farthest from the mean and therefore contributes most to the standard deviation?
The number farthest from the mean that contributes the most to the given standard deviation is
which represents the number of floors in
Expert Solution
Step 1
* SOLUTION :-

Trending now
This is a popular solution!

Step by step
Solved in 3 steps with 3 images

Recommended textbooks for you
MATLAB: An Introduction with Applications
Statistics
ISBN:
9781119256830
Author:
Amos Gilat
Publisher:
John Wiley & Sons Inc

Probability and Statistics for Engineering and th…
Statistics
ISBN:
9781305251809
Author:
Jay L. Devore
Publisher:
Cengage Learning

Statistics for The Behavioral Sciences (MindTap C…
Statistics
ISBN:
9781305504912
Author:
Frederick J Gravetter, Larry B. Wallnau
Publisher:
Cengage Learning
MATLAB: An Introduction with Applications
Statistics
ISBN:
9781119256830
Author:
Amos Gilat
Publisher:
John Wiley & Sons Inc
Probability and Statistics for Engineering and th…
Statistics
ISBN:
9781305251809
Author:
Jay L. Devore
Publisher:
Cengage Learning
Statistics for The Behavioral Sciences (MindTap C…
Statistics
ISBN:
9781305504912
Author:
Frederick J Gravetter, Larry B. Wallnau
Publisher:
Cengage Learning

Elementary Statistics: Picturing the World (7th E…
Statistics
ISBN:
9780134683416
Author:
Ron Larson, Betsy Farber
Publisher:
PEARSON

The Basic Practice of Statistics
Statistics
ISBN:
9781319042578
Author:
David S. Moore, William I. Notz, Michael A. Fligner
Publisher:
W. H. Freeman

Introduction to the Practice of Statistics
Statistics
ISBN:
9781319013387
Author:
David S. Moore, George P. McCabe, Bruce A. Craig
Publisher:
W. H. Freeman