The table below shows the number of state-registered automatic weapons and the murder rate for several Northwestern states. I Y I thousands of automatic weapons y murders per 100,000 residents 11.7 14.3 Use your calculator to determine the equation of the regression line. (Round to 2 decimal places) 1 8.5 7 3.4 2.5 2.7 2.4 0.6 11.6 9.7 7.2 5.9 6.5 6.4 4.6 Determine the regression equation in y = ax + b form and write it below. Answer= A) How many murders per 100,000 residents can be expected in a state with 5.4 thousand automatic weapons? Answer= Round to 3 decimal places. B) How many murders per 100,000 residents can be expected in a state with 6.5 thousand automatic weapons? Round to 3 decimal places.
The table below shows the number of state-registered automatic weapons and the murder rate for several Northwestern states. I Y I thousands of automatic weapons y murders per 100,000 residents 11.7 14.3 Use your calculator to determine the equation of the regression line. (Round to 2 decimal places) 1 8.5 7 3.4 2.5 2.7 2.4 0.6 11.6 9.7 7.2 5.9 6.5 6.4 4.6 Determine the regression equation in y = ax + b form and write it below. Answer= A) How many murders per 100,000 residents can be expected in a state with 5.4 thousand automatic weapons? Answer= Round to 3 decimal places. B) How many murders per 100,000 residents can be expected in a state with 6.5 thousand automatic weapons? Round to 3 decimal places.

MATLAB: An Introduction with Applications
6th Edition
ISBN:9781119256830
Author:Amos Gilat
Publisher:Amos Gilat
Chapter1: Starting With Matlab
Section: Chapter Questions
Problem 1P

Related questions
Question
Help

Transcribed Image Text:my
Use the data and story to answer the following questions
The table below shows the number of state-registered automatic weapons and the murder rate for
several Northwestern states.
E
D
= thousands of automatic weapons
y = murders per 100,000 residents
Use your calculator to determine the equation of the regression line. (Round to 2 decimal places)
Determine the regression equation in y = ax + b form and write it below.
Answer =
A) How many murders per 100,000 residents can be expected in a state with 5.4 thousand automatic
weapons?
Answer=
Linear Regression Application, Interpolation and Extrapolation
Round to 3 decimal places.
B) How many murders per 100,000 residents can be expected in a state with 6.5 thousand automatic
weapons?
$
4
I
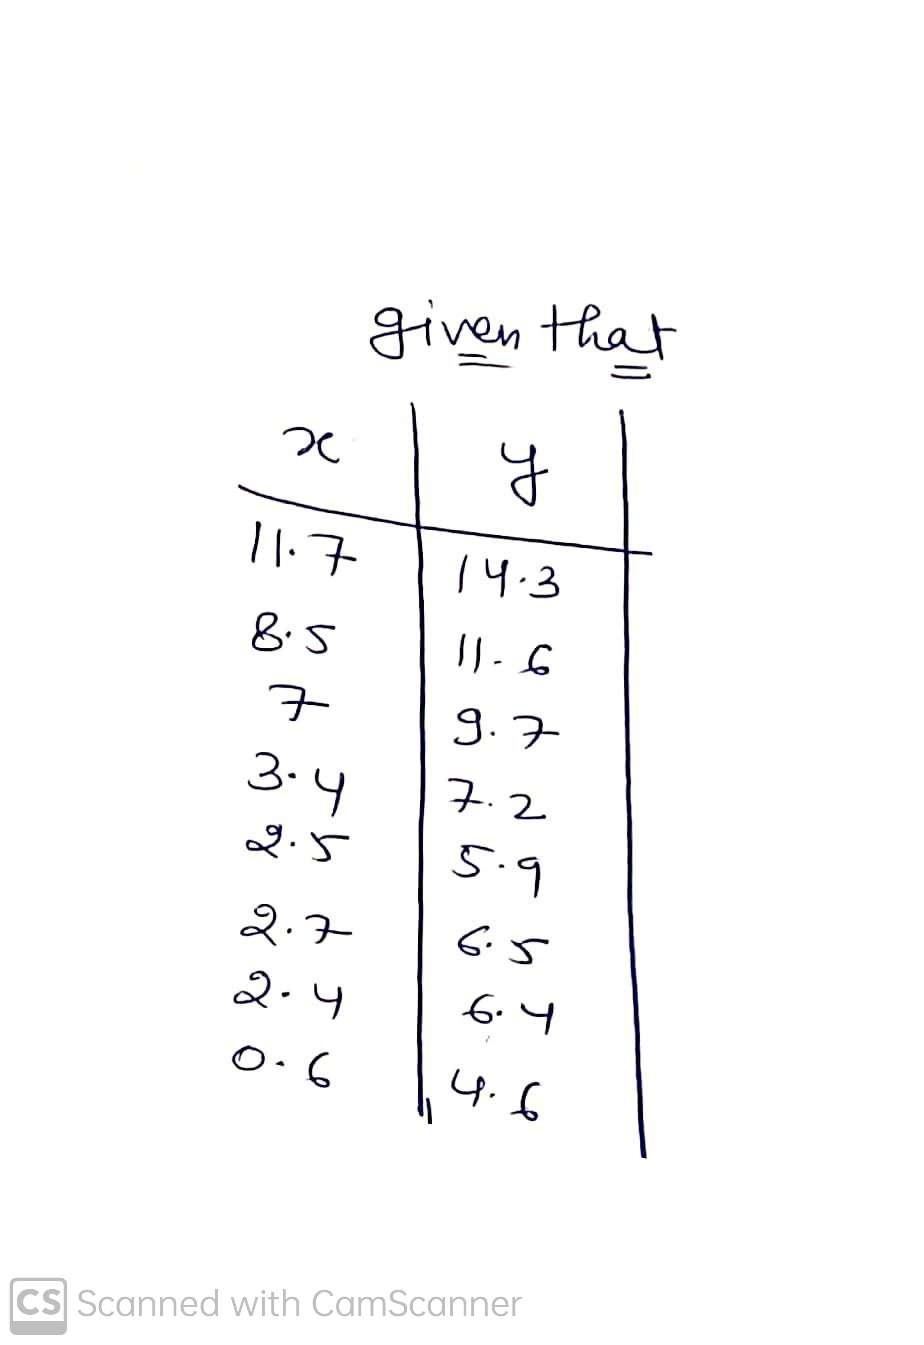
11.7
Y 14.3
IO
Question Help: Video Message instructor
R
%
8.5 7 3.4 2.5 2.7 2.4 0.6
11.6 9.7 7.2 5.9 6.5 6.4 4.6
5
T
G
▬▬
Round to 3 decimal places.
Q Search
Y
&
H
4-
7
4+
*
00
8
K
29
Expert Solution
Step 1
Given that
We have to find
Regression equation y=b+ax
A..How many murders per 100,000 residents can be expected in a state with 5.4 thousand automatic
B...How many murders per 100,000 residents can be expected in a state with 6.5 thousand automatic

Trending now
This is a popular solution!

Step by step
Solved in 3 steps with 3 images

Recommended textbooks for you
MATLAB: An Introduction with Applications
Statistics
ISBN:
9781119256830
Author:
Amos Gilat
Publisher:
John Wiley & Sons Inc

Probability and Statistics for Engineering and th…
Statistics
ISBN:
9781305251809
Author:
Jay L. Devore
Publisher:
Cengage Learning

Statistics for The Behavioral Sciences (MindTap C…
Statistics
ISBN:
9781305504912
Author:
Frederick J Gravetter, Larry B. Wallnau
Publisher:
Cengage Learning
MATLAB: An Introduction with Applications
Statistics
ISBN:
9781119256830
Author:
Amos Gilat
Publisher:
John Wiley & Sons Inc
Probability and Statistics for Engineering and th…
Statistics
ISBN:
9781305251809
Author:
Jay L. Devore
Publisher:
Cengage Learning
Statistics for The Behavioral Sciences (MindTap C…
Statistics
ISBN:
9781305504912
Author:
Frederick J Gravetter, Larry B. Wallnau
Publisher:
Cengage Learning

Elementary Statistics: Picturing the World (7th E…
Statistics
ISBN:
9780134683416
Author:
Ron Larson, Betsy Farber
Publisher:
PEARSON

The Basic Practice of Statistics
Statistics
ISBN:
9781319042578
Author:
David S. Moore, William I. Notz, Michael A. Fligner
Publisher:
W. H. Freeman

Introduction to the Practice of Statistics
Statistics
ISBN:
9781319013387
Author:
David S. Moore, George P. McCabe, Bruce A. Craig
Publisher:
W. H. Freeman