The table below shows the frequency distribution of the weights (in grams) of pre-1964 quarters. stogram below Weight (9) 6.000-6.049 Frequency 2 OA. 6.050-6.099 6.100-6.149 6.150-6.199 10 63 6.2 Weight (grams) 6.4 6.200-6.249 6.250-6.299 6.300-6.349 11 6 3 OB. O B. 6.350-6.399 1 10어 Use the frequency distribution to construct a histogram. Does the histogram appear to depict data that have a normal distribution? Why or why not? 6.1 62 6.3 Weight (grams) OC. 6.1 62 6.3 6.4 Weight (grams) Does the histogram appear to depict data that have a normal distribution? O A. The histogram does not appear to depict a normal distribution. The frequencies generally decrease to a minimum and then increase, and the histogram is roughly symmetric. O B. The histogram appears to depict a normal distribution. The frequencies generally increase to a maximum and then decrease, and the histogram is roughly symmetric. OC. The histogram does not appear to depict a normal distribution. The frequencies generally increase and the histogram is roughly symmetric. OD. The histogram appears to depict a normal distribution. The frequencies generally decrease to a minimum and then increase.
The table below shows the frequency distribution of the weights (in grams) of pre-1964 quarters. stogram below Weight (9) 6.000-6.049 Frequency 2 OA. 6.050-6.099 6.100-6.149 6.150-6.199 10 63 6.2 Weight (grams) 6.4 6.200-6.249 6.250-6.299 6.300-6.349 11 6 3 OB. O B. 6.350-6.399 1 10어 Use the frequency distribution to construct a histogram. Does the histogram appear to depict data that have a normal distribution? Why or why not? 6.1 62 6.3 Weight (grams) OC. 6.1 62 6.3 6.4 Weight (grams) Does the histogram appear to depict data that have a normal distribution? O A. The histogram does not appear to depict a normal distribution. The frequencies generally decrease to a minimum and then increase, and the histogram is roughly symmetric. O B. The histogram appears to depict a normal distribution. The frequencies generally increase to a maximum and then decrease, and the histogram is roughly symmetric. OC. The histogram does not appear to depict a normal distribution. The frequencies generally increase and the histogram is roughly symmetric. OD. The histogram appears to depict a normal distribution. The frequencies generally decrease to a minimum and then increase.

MATLAB: An Introduction with Applications
6th Edition
ISBN:9781119256830
Author:Amos Gilat
Publisher:Amos Gilat
Chapter1: Starting With Matlab
Section: Chapter Questions
Problem 1P

Related questions
Question

Transcribed Image Text:question
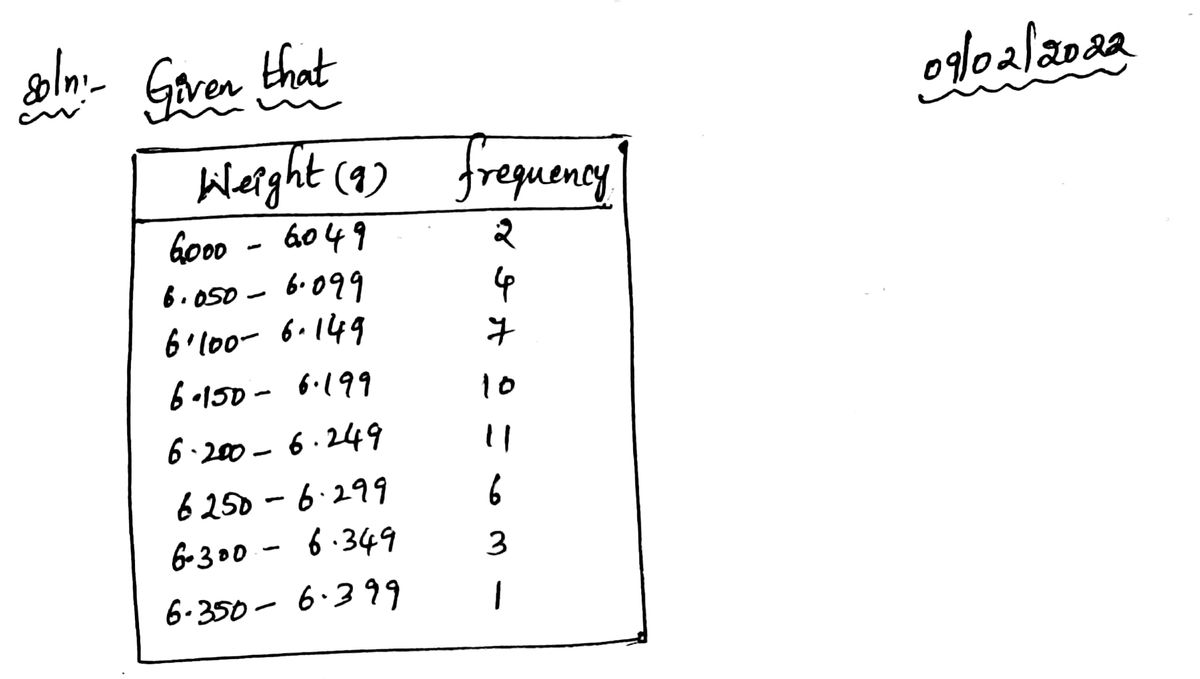
The table below shows the frequency distribution of the weights (in grams) of pre-1964 quarters.
Ch
stogram below.
Weight (g)
6.000-6.049
Frequency
OA.
10-
6.050-6.099
4
6.100-6.149
7
6.150-6.199
10
0-
6.2
6.3
6.4
6.200-6.249
11
Weight (grams)
6.250-6.299
6
6.300-6.349
3
OB.
6.350-6.399
1
10-
Use the frequency distribution to construct a histogram. Does the histogram appear to depict data that have a normal distribution? Why or why not?
6.1
6.3
6.4
Weight (grams)
OC.
20-
15-
10-
6.1
6.2
6.3
6.4
Weight (grams)
Does the histogram appear to depict data that have a normal distribution?
O A. The histogram does not appear to depict a normal distribution. The frequencies generally decrease to a minimum and then increase, and the
histogram is roughly symmetric.
O B. The histogram appears to depict a normal distribution. The frequencies generally increase to a maximum and then decrease, and the histogram is
roughly symmetric.
OC. The histogram does not appear to depict a normal distribution. The frequencies generally increase and the histogram is roughly symmetric.
O D. The histogram appears to depict a normal distribution. The frequencies generally decrease to a minimum and then increase.
Kouanbay
Guanbaig
Expert Solution
Step 1

Trending now
This is a popular solution!

Step by step
Solved in 2 steps with 2 images

Recommended textbooks for you
MATLAB: An Introduction with Applications
Statistics
ISBN:
9781119256830
Author:
Amos Gilat
Publisher:
John Wiley & Sons Inc

Probability and Statistics for Engineering and th…
Statistics
ISBN:
9781305251809
Author:
Jay L. Devore
Publisher:
Cengage Learning

Statistics for The Behavioral Sciences (MindTap C…
Statistics
ISBN:
9781305504912
Author:
Frederick J Gravetter, Larry B. Wallnau
Publisher:
Cengage Learning
MATLAB: An Introduction with Applications
Statistics
ISBN:
9781119256830
Author:
Amos Gilat
Publisher:
John Wiley & Sons Inc
Probability and Statistics for Engineering and th…
Statistics
ISBN:
9781305251809
Author:
Jay L. Devore
Publisher:
Cengage Learning
Statistics for The Behavioral Sciences (MindTap C…
Statistics
ISBN:
9781305504912
Author:
Frederick J Gravetter, Larry B. Wallnau
Publisher:
Cengage Learning

Elementary Statistics: Picturing the World (7th E…
Statistics
ISBN:
9780134683416
Author:
Ron Larson, Betsy Farber
Publisher:
PEARSON

The Basic Practice of Statistics
Statistics
ISBN:
9781319042578
Author:
David S. Moore, William I. Notz, Michael A. Fligner
Publisher:
W. H. Freeman

Introduction to the Practice of Statistics
Statistics
ISBN:
9781319013387
Author:
David S. Moore, George P. McCabe, Bruce A. Craig
Publisher:
W. H. Freeman