The table below lists the number of games played in a yearly best-of-seven baseball championship series, along with the expected proportions for the number of games played with teams of equal abilities. Use a 0.05 significance level to test the claim that the actual numbers of games fit the distribution indicated by the expected proportions. Games Played Actual contests 6 24 5 4 7. 18 19 4. 38 2 Expected proportion ho: me uuser veu reyuerés ayree wifi ue'expécieu prupofuuns H: At least one of the observed frequencies do not agree with the expected proportions. Calculate the test statistic, . y2 = (Round to three decimal places as needed.)
The table below lists the number of games played in a yearly best-of-seven baseball championship series, along with the expected proportions for the number of games played with teams of equal abilities. Use a 0.05 significance level to test the claim that the actual numbers of games fit the distribution indicated by the expected proportions. Games Played Actual contests 6 24 5 4 7. 18 19 4. 38 2 Expected proportion ho: me uuser veu reyuerés ayree wifi ue'expécieu prupofuuns H: At least one of the observed frequencies do not agree with the expected proportions. Calculate the test statistic, . y2 = (Round to three decimal places as needed.)

MATLAB: An Introduction with Applications
6th Edition
ISBN:9781119256830
Author:Amos Gilat
Publisher:Amos Gilat
Chapter1: Starting With Matlab
Section: Chapter Questions
Problem 1P

Related questions
Question

Transcribed Image Text:The table below lists the number of games played in a yearly best-of-seven baseball championship series, along with the expected proportions for the number of games played with teams of
equal abilities. Use a 0.05 significance level to test the claim that the actual numbers of games fit the distribution indicated by the expected proportions.
Games Played
Actual contests
6
24
5
4
7.
18
19
4.
38
2
Expected proportion
ho: me uuser veu reyuerés ayree wifi ue'expécieu prupofuuns
H: At least one of the observed frequencies do not agree with the expected proportions.
Calculate the test statistic, .
y2 = (Round to three decimal places as needed.)
Expert Solution
Step 1
Given that:
| Games Played | 4 | 5 | 6 | 7 |
| Actual contests | 18 | 19 | 24 | 38 |
| Expected proportion |
Significance level,
Step 2
State the null and alternative hypotheses:
Find the total count:
Compute the expected frequencies by using the formula:
Use table to find the expected frequency:
| Actual Contests | Expected proportion | Expected frequency |
| 18 | ||
| 19 | ||
| 24 | ||
| 38 | ||
Compute the test statistic:
Obtain the degrees of freedom:
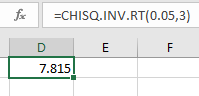
Determine the critical value at 0.05 significance level and 3 degrees of freedom by using the following excel function:

Trending now
This is a popular solution!

Step by step
Solved in 3 steps with 1 images

Recommended textbooks for you
MATLAB: An Introduction with Applications
Statistics
ISBN:
9781119256830
Author:
Amos Gilat
Publisher:
John Wiley & Sons Inc

Probability and Statistics for Engineering and th…
Statistics
ISBN:
9781305251809
Author:
Jay L. Devore
Publisher:
Cengage Learning

Statistics for The Behavioral Sciences (MindTap C…
Statistics
ISBN:
9781305504912
Author:
Frederick J Gravetter, Larry B. Wallnau
Publisher:
Cengage Learning
MATLAB: An Introduction with Applications
Statistics
ISBN:
9781119256830
Author:
Amos Gilat
Publisher:
John Wiley & Sons Inc
Probability and Statistics for Engineering and th…
Statistics
ISBN:
9781305251809
Author:
Jay L. Devore
Publisher:
Cengage Learning
Statistics for The Behavioral Sciences (MindTap C…
Statistics
ISBN:
9781305504912
Author:
Frederick J Gravetter, Larry B. Wallnau
Publisher:
Cengage Learning

Elementary Statistics: Picturing the World (7th E…
Statistics
ISBN:
9780134683416
Author:
Ron Larson, Betsy Farber
Publisher:
PEARSON

The Basic Practice of Statistics
Statistics
ISBN:
9781319042578
Author:
David S. Moore, William I. Notz, Michael A. Fligner
Publisher:
W. H. Freeman

Introduction to the Practice of Statistics
Statistics
ISBN:
9781319013387
Author:
David S. Moore, George P. McCabe, Bruce A. Craig
Publisher:
W. H. Freeman