The table below contains three estimated regressions, which were computed in 2007 using data on employees. The data set used for the regressions consisted of information on over 10,000 full-time, full-year workers. Employees were surveyed on their earnings and whether they had graduated high school or not. The data set also contains information on the region of the country where the person lived (North / East / South / West), and the individual's gender and age. For the purposes of this quiz: AHE = average hourly earnings Graduated high school (X1) = binary variable (1 if the employee graduated high school, 0 if they did not) Male (X2) = binary variable (1 if male, 0 if female) Age (X3) = age in years North (X4) = binary variable (1 if Region = North, 0 otherwise) South (X5)= binary variable (1 if Region = South, 0 otherwise) East (X6) binary variable (1 if Region = East, 0 otherwise) Using the regression results in column (1): The calculated test statistic is_ (plz write in 2 decimal places) is the null hypothesis rejected at the 5% level of significance?
The table below contains three estimated regressions, which were computed in 2007 using data on employees. The data set used for the regressions consisted of information on over 10,000 full-time, full-year workers. Employees were surveyed on their earnings and whether they had graduated high school or not. The data set also contains information on the region of the country where the person lived (North / East / South / West), and the individual's gender and age. For the purposes of this quiz: AHE = average hourly earnings Graduated high school (X1) = binary variable (1 if the employee graduated high school, 0 if they did not) Male (X2) = binary variable (1 if male, 0 if female) Age (X3) = age in years North (X4) = binary variable (1 if Region = North, 0 otherwise) South (X5)= binary variable (1 if Region = South, 0 otherwise) East (X6) binary variable (1 if Region = East, 0 otherwise) Using the regression results in column (1): The calculated test statistic is_ (plz write in 2 decimal places) is the null hypothesis rejected at the 5% level of significance?
MATLAB: An Introduction with Applications
6th Edition
ISBN:9781119256830
Author:Amos Gilat
Publisher:Amos Gilat
Chapter1: Starting With Matlab
Section: Chapter Questions
Problem 1P
Related questions
Question

Transcribed Image Text:23:01
Done
A S
Male (X2) = binary variable (1 if male, 0 if female)
Age (X3) = age in years
North (X4) = binary variable (1 if Region = North, 0 otherwise)
South (X5) = binary variable (1 if Region = South, 0 otherwise)
East (X6) = binary variable (1 if Region = East, 0 otherwise)
Using the regression results in column (1):
The calculated test statistic is_
The table below contains three estimated regressions, which were computed in 2007 using data on
employees. The data set used for the regressions consisted of information on over 10,000
full-time, full-year workers. Employees were surveyed on their earnings and whether they had
graduated high school or not. The data set also contains information on the region of the country
where the person lived (North / East / South / West), and the individual's gender and age.
(plz write in 2 decimal places)
is the null hypothesis rejected at the 5% level of significance?_
DO
For the purposes of this quiz:
AHE = average hourly earnings
Graduated high school (X1) = binary variable (1 if the employee graduated high school, 0 if they
did not)
Full Text:188
1
T
=
28
x
운지
+

Transcribed Image Text:Results of Regressions of Average Hourly Earnings on Gender and Education Binary
Variables and Other Characteristics Using 2007 Data from the Current Population Survey
Dependent variable: average hourly earnings (AHE).
Regressor
Graduated high school (X₁)
Male (X₂)
Age (X3)
North (X4)
South (XS)
East (X6)
Intercept
F-statistic for regional effects
SER
R²
n
= 0
0.352
(0.021)
0.458
(0.021)
12.84
(0.018)
1.026
0.0710
10973
2
0.373
(0.021)
0.457
(0.020)
0.011
(0.001)
12.471
(0.049)
1.023
0.0761
10973
3
0.371
(0.021)
0.451
(0.020)
0.011
(0.001)
0.175
(0.37)
0.103
(0.033)
-0.102
(0.043)
12.390
(0.057)
21.87
1.020
0.0814
10973
Expert Solution
This question has been solved!
Explore an expertly crafted, step-by-step solution for a thorough understanding of key concepts.
Step by step
Solved in 3 steps with 5 images

Follow-up Questions
Read through expert solutions to related follow-up questions below.
Follow-up Question

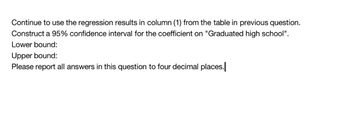
Transcribed Image Text:Continue to use the regression results in column (1) from the table in previous question.
Construct a 95% confidence interval for the coefficient on "Graduated high school".
Lower bound:
Upper bound:
Please report all answers in this question to four decimal places.
Solution
Recommended textbooks for you

MATLAB: An Introduction with Applications
Statistics
ISBN:
9781119256830
Author:
Amos Gilat
Publisher:
John Wiley & Sons Inc

Probability and Statistics for Engineering and th…
Statistics
ISBN:
9781305251809
Author:
Jay L. Devore
Publisher:
Cengage Learning

Statistics for The Behavioral Sciences (MindTap C…
Statistics
ISBN:
9781305504912
Author:
Frederick J Gravetter, Larry B. Wallnau
Publisher:
Cengage Learning

MATLAB: An Introduction with Applications
Statistics
ISBN:
9781119256830
Author:
Amos Gilat
Publisher:
John Wiley & Sons Inc

Probability and Statistics for Engineering and th…
Statistics
ISBN:
9781305251809
Author:
Jay L. Devore
Publisher:
Cengage Learning

Statistics for The Behavioral Sciences (MindTap C…
Statistics
ISBN:
9781305504912
Author:
Frederick J Gravetter, Larry B. Wallnau
Publisher:
Cengage Learning

Elementary Statistics: Picturing the World (7th E…
Statistics
ISBN:
9780134683416
Author:
Ron Larson, Betsy Farber
Publisher:
PEARSON

The Basic Practice of Statistics
Statistics
ISBN:
9781319042578
Author:
David S. Moore, William I. Notz, Michael A. Fligner
Publisher:
W. H. Freeman

Introduction to the Practice of Statistics
Statistics
ISBN:
9781319013387
Author:
David S. Moore, George P. McCabe, Bruce A. Craig
Publisher:
W. H. Freeman