Answer part c

Glencoe Algebra 1, Student Edition, 9780079039897, 0079039898, 2018
18th Edition
ISBN:9780079039897
Author:Carter
Publisher:Carter
Chapter10: Statistics
Section10.3: Measures Of Spread
Problem 23PFA

Related questions
Question
Answer part c

Transcribed Image Text:A nutritionist wants to determine how much time nationally people spend eating and drinking. Suppose for a random sample of 998 people age 15 or older, the mean amount of time
spent eating or drinking per day is 1.03 hours with a standard deviation of 0.63 hour. Complete parts (a) through (d) below.
A. The sample size is less than 5% of the population.
OB. The sample size is less than 10% of the population.
OC. The sample size is greater than 5% of the population.
OD. The sample size is greater than 10% of the population.
(c) Determine and interpret a 95% confidence interval for the mean amount of time Americans age 15 or older spend eating and drinking each day.
Select the correct choice below and fill in the answer boxes, if applicable, in your choice.
(Type integers or decimals rounded to three decimal places as needed. Use ascending order.)
OA. The nutritionist is 95% confident that the mean amount of time spent eating or drinking per day is between
and hours.
B. There is a 95% probability that the mean amount of time spent eating or drinking per day is between
OC. The nutritionist is 95% confident that the amount of time spent eating or drinking per day for any individual is between
O D. The requirements for constructing a confidence interval are not satisfied.
√
Vi
and hours.
and
hours.
X
Expert Solution
This question has been solved!
Explore an expertly crafted, step-by-step solution for a thorough understanding of key concepts.

This is a popular solution!

Trending now
This is a popular solution!

Step by step
Solved in 4 steps with 3 images

Follow-up Questions
Read through expert solutions to related follow-up questions below.
Follow-up Question
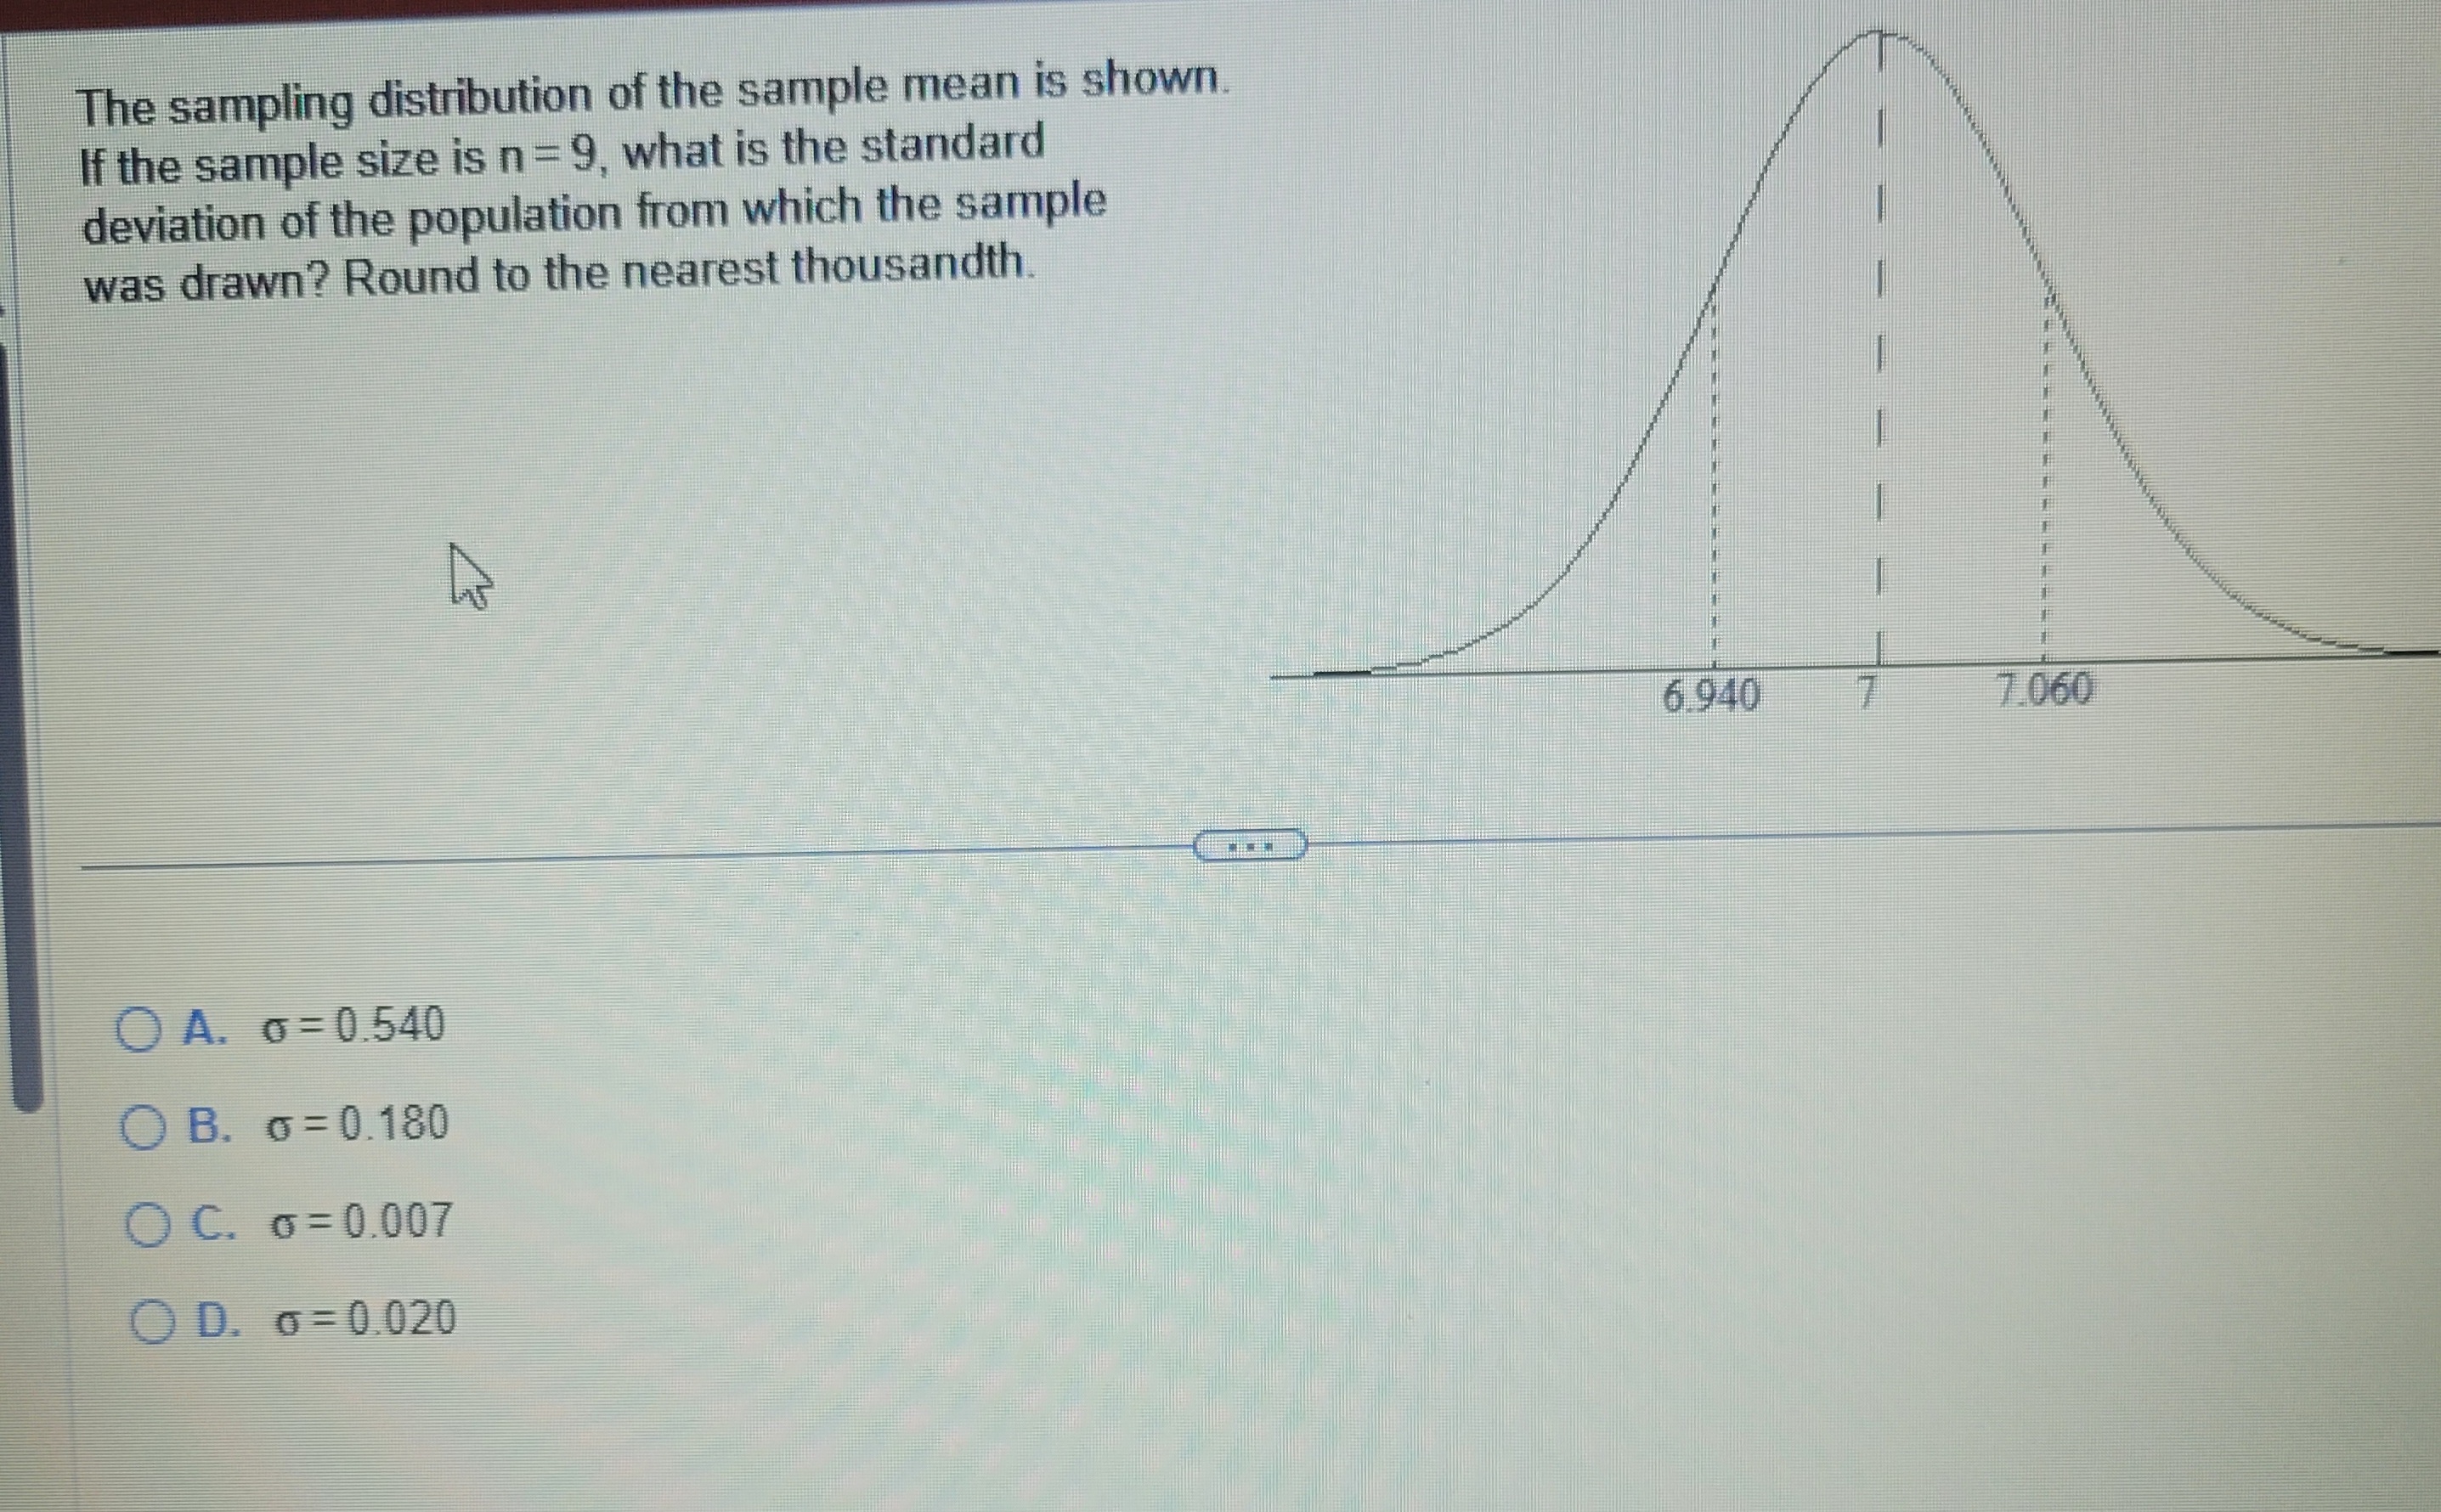
Transcribed Image Text:The sampling distribution of the sample mean is shown.
If the sample size is n=9, what is the standard
deviation of the population from which the sample
was drawn? Round to the nearest thousandth.
A. o=0.540
OB. o 0.180
OC. o=0.007
OD. o=0.020
***
11
6.940
7.060
Solution
Recommended textbooks for you
Glencoe Algebra 1, Student Edition, 9780079039897…
Algebra
ISBN:
9780079039897
Author:
Carter
Publisher:
McGraw Hill

Big Ideas Math A Bridge To Success Algebra 1: Stu…
Algebra
ISBN:
9781680331141
Author:
HOUGHTON MIFFLIN HARCOURT
Publisher:
Houghton Mifflin Harcourt
Glencoe Algebra 1, Student Edition, 9780079039897…
Algebra
ISBN:
9780079039897
Author:
Carter
Publisher:
McGraw Hill
Big Ideas Math A Bridge To Success Algebra 1: Stu…
Algebra
ISBN:
9781680331141
Author:
HOUGHTON MIFFLIN HARCOURT
Publisher:
Houghton Mifflin Harcourt