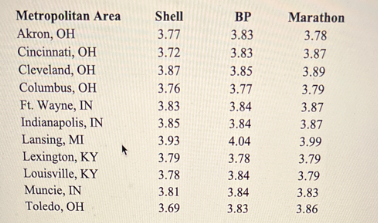
The price drivers pay for gasoline often varies a great deal across regions throughout United States. The following data show the price per gallon for regular gasoline for a random sample of gasoline service stations for three major brands of gasoline (Shell, and Marathon) located in 11 metropolitan areas across the upper Midwest region (OhioGasPrices.com website, March 18, 2012). Metropolitan Area Akron, OH Cincinnati, OH Shell BP Marathon 3.77 3.83 3.78 3.72 3.83 3.87 Cleveland, OH 3.87 3.85 3.89 Columbus, OH Ft. Wayne, IN Indianapolis, IN Lansing, MI Lexington, KY 3.76 3.77 3.79 3.83 3.84 3.87 3.85 3.84 3.87 3.93 4.04 3.99 3.79 3.78 3.79 Louisville, KY 3.78 3.84 3.79 Muncie, IN Toledo, OH 3.81 3.84 3.83 3.69 3.83 3.86 Use a = 0.05 to test for any significant difference in the mean price of gasoline for the three brands.
The price drivers pay for gasoline often varies a great deal across regions throughout United States. The following data show the price per gallon for regular gasoline for a random sample of gasoline service stations for three major brands of gasoline (Shell, and Marathon) located in 11 metropolitan areas across the upper Midwest region (OhioGasPrices.com website, March 18, 2012). Metropolitan Area Akron, OH Cincinnati, OH Shell BP Marathon 3.77 3.83 3.78 3.72 3.83 3.87 Cleveland, OH 3.87 3.85 3.89 Columbus, OH Ft. Wayne, IN Indianapolis, IN Lansing, MI Lexington, KY 3.76 3.77 3.79 3.83 3.84 3.87 3.85 3.84 3.87 3.93 4.04 3.99 3.79 3.78 3.79 Louisville, KY 3.78 3.84 3.79 Muncie, IN Toledo, OH 3.81 3.84 3.83 3.69 3.83 3.86 Use a = 0.05 to test for any significant difference in the mean price of gasoline for the three brands.
MATLAB: An Introduction with Applications
6th Edition
ISBN:9781119256830
Author:Amos Gilat
Publisher:Amos Gilat
Chapter1: Starting With Matlab
Section: Chapter Questions
Problem 1P
Related questions
Question
Work the problem on excel and give conclusions

Transcribed Image Text:The table below presents the price per gallon for regular gasoline from a random sample of service stations across the upper Midwest region of the United States. The data, collected on March 18, 2012, shows the prices for three major gasoline brands: Shell, BP, and Marathon, across 11 metropolitan areas.
| Metropolitan Area | Shell | BP | Marathon |
|-----------------------|-------|------|----------|
| Akron, OH | 3.77 | 3.83 | 3.78 |
| Cincinnati, OH | 3.72 | 3.83 | 3.87 |
| Cleveland, OH | 3.87 | 3.85 | 3.89 |
| Columbus, OH | 3.83 | 3.77 | 3.82 |
| Ft. Wayne, IN | 3.83 | 3.84 | 3.87 |
| Indianapolis, IN | 3.85 | 3.84 | 3.89 |
| Lansing, MI | 3.95 | 3.82 | 3.86 |
| Lexington, KY | 3.79 | 3.78 | 3.79 |
| Louisville, KY | 3.79 | 3.84 | 3.79 |
| Muncie, IN | 3.81 | 3.84 | 3.87 |
| Toledo, OH | 3.69 | 3.83 | 3.86 |
**Instructions:** Use \(\alpha = 0.05\) to test for any significant difference in the mean price of gasoline for the three brands.
**Graph/Diagram Explanation:**
There are no graphs or diagrams provided in the text. The focus is on the tabulated data showing gasoline prices by brand and location. To analyze these prices, statistical methods such as ANOVA could be used to test for significant differences across the brands.
Expert Solution
Step 1
Given data :

Trending now
This is a popular solution!
Step by step
Solved in 4 steps with 2 images

Recommended textbooks for you

MATLAB: An Introduction with Applications
Statistics
ISBN:
9781119256830
Author:
Amos Gilat
Publisher:
John Wiley & Sons Inc

Probability and Statistics for Engineering and th…
Statistics
ISBN:
9781305251809
Author:
Jay L. Devore
Publisher:
Cengage Learning

Statistics for The Behavioral Sciences (MindTap C…
Statistics
ISBN:
9781305504912
Author:
Frederick J Gravetter, Larry B. Wallnau
Publisher:
Cengage Learning

MATLAB: An Introduction with Applications
Statistics
ISBN:
9781119256830
Author:
Amos Gilat
Publisher:
John Wiley & Sons Inc

Probability and Statistics for Engineering and th…
Statistics
ISBN:
9781305251809
Author:
Jay L. Devore
Publisher:
Cengage Learning

Statistics for The Behavioral Sciences (MindTap C…
Statistics
ISBN:
9781305504912
Author:
Frederick J Gravetter, Larry B. Wallnau
Publisher:
Cengage Learning

Elementary Statistics: Picturing the World (7th E…
Statistics
ISBN:
9780134683416
Author:
Ron Larson, Betsy Farber
Publisher:
PEARSON

The Basic Practice of Statistics
Statistics
ISBN:
9781319042578
Author:
David S. Moore, William I. Notz, Michael A. Fligner
Publisher:
W. H. Freeman

Introduction to the Practice of Statistics
Statistics
ISBN:
9781319013387
Author:
David S. Moore, George P. McCabe, Bruce A. Craig
Publisher:
W. H. Freeman