The percentage of the population lacking functional literacy skills and the percentage of the population living below 50% of median income is given in the following table for eight highly developed countries: Country Select one: O a. (-0.23, 13.38) O b. (0.35, 1.48) O c. (0.38, 1.45) O d. (0.16, 12.99) Pop. living Pop. lacking below 50% of functional median income literacy skills (x) (y) Australia Canada 11.4 Ireland 16.2 Switzerland 7.6 United States 17.0 Denmark 5.6 12.5 United Kingdom Germany 8.4 Assuming that the regression model assumptions are valid, construct a 95% confidence interval for $₁. 12.2 17.0 14.6 22.6 15.9 20.0 9.6 21.8 14.4
The percentage of the population lacking functional literacy skills and the percentage of the population living below 50% of median income is given in the following table for eight highly developed countries: Country Select one: O a. (-0.23, 13.38) O b. (0.35, 1.48) O c. (0.38, 1.45) O d. (0.16, 12.99) Pop. living Pop. lacking below 50% of functional median income literacy skills (x) (y) Australia Canada 11.4 Ireland 16.2 Switzerland 7.6 United States 17.0 Denmark 5.6 12.5 United Kingdom Germany 8.4 Assuming that the regression model assumptions are valid, construct a 95% confidence interval for $₁. 12.2 17.0 14.6 22.6 15.9 20.0 9.6 21.8 14.4

MATLAB: An Introduction with Applications
6th Edition
ISBN:9781119256830
Author:Amos Gilat
Publisher:Amos Gilat
Chapter1: Starting With Matlab
Section: Chapter Questions
Problem 1P

Related questions
Question

Transcribed Image Text:The percentage of the population lacking functional literacy skills and the percentage of the population living below 50% of median income is given in the following table for eight
highly developed countries:
Select one:
Country
a. (-0.23, 13.38)
b.
(0.35, 1.48)
c.
(0.38, 1.45)
O d. (0.16, 12.99)
Australia
Canada
Ireland
Switzerland
Pop. living Pop. lacking
below 50% of functional
median income literacy skills
(x)
(y)
12.2
United States
Denmark
United Kingdom
Germany
Assuming that the regression model assumptions are valid, construct a 95% confidence interval for ₁.
11.4
16.2
7.6
17.0
5.6
12.5
8.4
17.0
14.6
22.6
15.9
20.0
9.6
21.8
14.4
Expert Solution
Step 1: Define the formula of confidence interval for slope.
The formula of confidence interval for slope is,
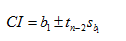
Where,
bl denotes the slope
Sb1 denotes the standard error of slope.

Step by step
Solved in 4 steps with 5 images

Recommended textbooks for you
MATLAB: An Introduction with Applications
Statistics
ISBN:
9781119256830
Author:
Amos Gilat
Publisher:
John Wiley & Sons Inc

Probability and Statistics for Engineering and th…
Statistics
ISBN:
9781305251809
Author:
Jay L. Devore
Publisher:
Cengage Learning

Statistics for The Behavioral Sciences (MindTap C…
Statistics
ISBN:
9781305504912
Author:
Frederick J Gravetter, Larry B. Wallnau
Publisher:
Cengage Learning
MATLAB: An Introduction with Applications
Statistics
ISBN:
9781119256830
Author:
Amos Gilat
Publisher:
John Wiley & Sons Inc
Probability and Statistics for Engineering and th…
Statistics
ISBN:
9781305251809
Author:
Jay L. Devore
Publisher:
Cengage Learning
Statistics for The Behavioral Sciences (MindTap C…
Statistics
ISBN:
9781305504912
Author:
Frederick J Gravetter, Larry B. Wallnau
Publisher:
Cengage Learning

Elementary Statistics: Picturing the World (7th E…
Statistics
ISBN:
9780134683416
Author:
Ron Larson, Betsy Farber
Publisher:
PEARSON

The Basic Practice of Statistics
Statistics
ISBN:
9781319042578
Author:
David S. Moore, William I. Notz, Michael A. Fligner
Publisher:
W. H. Freeman

Introduction to the Practice of Statistics
Statistics
ISBN:
9781319013387
Author:
David S. Moore, George P. McCabe, Bruce A. Craig
Publisher:
W. H. Freeman