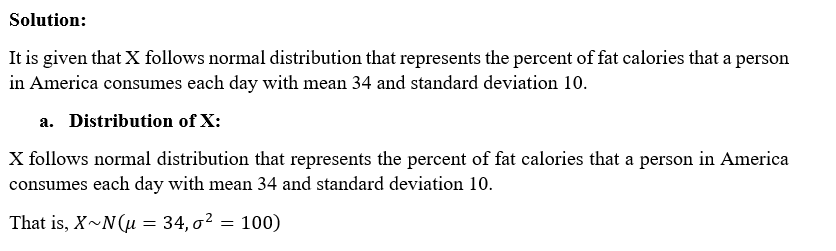
The percent of fat calories that a person in America consumes each day is normally distributed with a mean of about 34 and a standard deviation of 10. Suppose that one individual is randomly chosen. Let X=percent of fat calories.
The percent of fat calories that a person in America consumes each day is normally distributed with a mean of about 34 and a standard deviation of 10. Suppose that one individual is randomly chosen. Let X=percent of fat calories.

MATLAB: An Introduction with Applications
6th Edition
ISBN:9781119256830
Author:Amos Gilat
Publisher:Amos Gilat
Chapter1: Starting With Matlab
Section: Chapter Questions
Problem 1P

Related questions
Question
I need the answers for this question please.
Thank you
![Title: Understanding the Distribution of Fat Calorie Percentages in America
Introduction:
This exercise explores the distribution of the percentage of fat calories that a person in America consumes each day. It assumes that this percentage is normally distributed with a mean (μ) of 34 and a standard deviation (σ) of 10.
Exercise:
Let's analyze the distribution and calculate probabilities based on this normal distribution.
1. Distribution of X:
What is the distribution of \( X \), where \( X \) is the percent of fat calories consumed?
\[
X \sim N(\mu, \sigma^2)
\]
Here, the mean \( \mu = 34 \) and the standard deviation \( \sigma = 10 \).
Answer: \( X \sim N(34, 10^2) \)
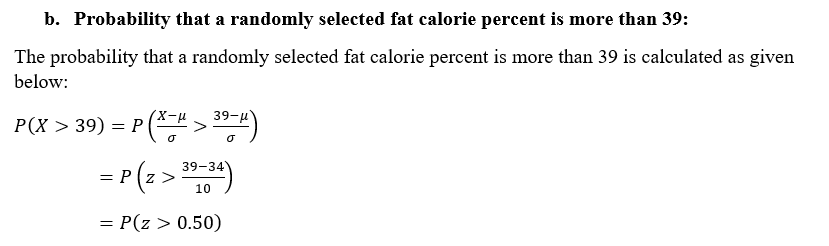
2. Probability Calculation:
Find the probability that a randomly selected fat calorie percent is more than 39. Round your answer to 4 decimal places.
To find this probability, calculate the Z-score using the formula:
\[
Z = \frac{X - \mu}{\sigma}
\]
Where \( X = 39 \), \( \mu = 34 \), and \( \sigma = 10 \).
\[
Z = \frac{39 - 34}{10} = \frac{5}{10} = 0.5
\]
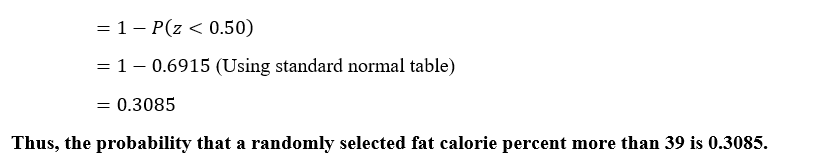
Use the Z-table to find the area to the right of Z=0.5.
Answer: The probability is approximately 0.3085 (rounded to 4 decimal places).
3. Lower Quartile Calculation:
Find the minimum number for the lower quartile of fat calories. Round your answer to 2 decimal places.
To find the lower quartile (Q1), use the Z-score that corresponds to the 25th percentile. The Z-score for the 25th percentile is approximately -0.675.
Convert this Z-score to an X value using the formula:
\[
X = \mu + Z \cdot \sigma
\]
\[
X = 34 + (-0.675) \cdot 10 = 34 - 6.75 = 27.25
\]
Answer: The lower quartile is approximately 27.25](/v2/_next/image?url=https%3A%2F%2Fcontent.bartleby.com%2Fqna-images%2Fquestion%2Fadb58edc-76a8-4215-8abd-8e37e0700ca4%2F2029520d-319f-48b7-9f63-97bc8f6d3f57%2Fuxczsqy.jpeg&w=3840&q=75)
Transcribed Image Text:Title: Understanding the Distribution of Fat Calorie Percentages in America
Introduction:
This exercise explores the distribution of the percentage of fat calories that a person in America consumes each day. It assumes that this percentage is normally distributed with a mean (μ) of 34 and a standard deviation (σ) of 10.
Exercise:
Let's analyze the distribution and calculate probabilities based on this normal distribution.
1. Distribution of X:
What is the distribution of \( X \), where \( X \) is the percent of fat calories consumed?
\[
X \sim N(\mu, \sigma^2)
\]
Here, the mean \( \mu = 34 \) and the standard deviation \( \sigma = 10 \).
Answer: \( X \sim N(34, 10^2) \)
2. Probability Calculation:
Find the probability that a randomly selected fat calorie percent is more than 39. Round your answer to 4 decimal places.
To find this probability, calculate the Z-score using the formula:
\[
Z = \frac{X - \mu}{\sigma}
\]
Where \( X = 39 \), \( \mu = 34 \), and \( \sigma = 10 \).
\[
Z = \frac{39 - 34}{10} = \frac{5}{10} = 0.5
\]
Use the Z-table to find the area to the right of Z=0.5.
Answer: The probability is approximately 0.3085 (rounded to 4 decimal places).
3. Lower Quartile Calculation:
Find the minimum number for the lower quartile of fat calories. Round your answer to 2 decimal places.
To find the lower quartile (Q1), use the Z-score that corresponds to the 25th percentile. The Z-score for the 25th percentile is approximately -0.675.
Convert this Z-score to an X value using the formula:
\[
X = \mu + Z \cdot \sigma
\]
\[
X = 34 + (-0.675) \cdot 10 = 34 - 6.75 = 27.25
\]
Answer: The lower quartile is approximately 27.25
Expert Solution
Step 1
Step 2

Step by step
Solved in 3 steps with 4 images

Knowledge Booster


Learn more about
Need a deep-dive on the concept behind this application? Look no further. Learn more about this topic, statistics and related others by exploring similar questions and additional content below.Recommended textbooks for you
MATLAB: An Introduction with Applications
Statistics
ISBN:
9781119256830
Author:
Amos Gilat
Publisher:
John Wiley & Sons Inc

Probability and Statistics for Engineering and th…
Statistics
ISBN:
9781305251809
Author:
Jay L. Devore
Publisher:
Cengage Learning

Statistics for The Behavioral Sciences (MindTap C…
Statistics
ISBN:
9781305504912
Author:
Frederick J Gravetter, Larry B. Wallnau
Publisher:
Cengage Learning
MATLAB: An Introduction with Applications
Statistics
ISBN:
9781119256830
Author:
Amos Gilat
Publisher:
John Wiley & Sons Inc
Probability and Statistics for Engineering and th…
Statistics
ISBN:
9781305251809
Author:
Jay L. Devore
Publisher:
Cengage Learning
Statistics for The Behavioral Sciences (MindTap C…
Statistics
ISBN:
9781305504912
Author:
Frederick J Gravetter, Larry B. Wallnau
Publisher:
Cengage Learning

Elementary Statistics: Picturing the World (7th E…
Statistics
ISBN:
9780134683416
Author:
Ron Larson, Betsy Farber
Publisher:
PEARSON

The Basic Practice of Statistics
Statistics
ISBN:
9781319042578
Author:
David S. Moore, William I. Notz, Michael A. Fligner
Publisher:
W. H. Freeman

Introduction to the Practice of Statistics
Statistics
ISBN:
9781319013387
Author:
David S. Moore, George P. McCabe, Bruce A. Craig
Publisher:
W. H. Freeman