A genetic experiment with peas resulted in one sample of offspring that consisted of 430 green peas and 152 yellow peas. a. Construct a 90% confidence interval to estimate of the percentage of yellow peas. b. Based on the confidence interval, do the results of the experiment appear to contradict the expectation that 25% of the offspring peas would be yellow? a. Construct a 90% confidence interval. Express the percentages in decimal form.
A genetic experiment with peas resulted in one sample of offspring that consisted of 430 green peas and 152 yellow peas. a. Construct a 90% confidence interval to estimate of the percentage of yellow peas. b. Based on the confidence interval, do the results of the experiment appear to contradict the expectation that 25% of the offspring peas would be yellow? a. Construct a 90% confidence interval. Express the percentages in decimal form.
MATLAB: An Introduction with Applications
6th Edition
ISBN:9781119256830
Author:Amos Gilat
Publisher:Amos Gilat
Chapter1: Starting With Matlab
Section: Chapter Questions
Problem 1P
Related questions
Question

Transcribed Image Text:A genetic experiment with peas resulted in one sample of offspring that consisted of 430 green peas and 152 yellow peas.
a. Construct a 90% confidence interval to estimate of the percentage of yellow peas.
b. Based on the confidence interval, do the results of the experiment appear to contradict the expectation that 25% of the offspring peas would be yellow?
a. Construct a 90% confidence interval. Express the percentages in decimal form.
(Round to three decimal places as needed.)
CHE
Expert Solution
This question has been solved!
Explore an expertly crafted, step-by-step solution for a thorough understanding of key concepts.
This is a popular solution!
Trending now
This is a popular solution!
Step by step
Solved in 4 steps with 5 images

Follow-up Questions
Read through expert solutions to related follow-up questions below.
Follow-up Question
Can you answer part b c and D

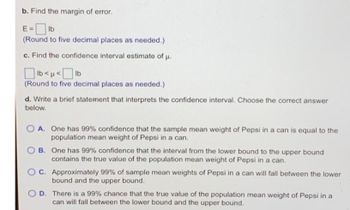
Transcribed Image Text:b. Find the margin of error.
E=lb
(Round to five decimal places as needed.)
c. Find the confidence interval estimate of μ.
lb<< [ lb
(Round to five decimal places as needed.)
d. Write a brief statement that interprets the confidence interval. Choose the correct answer
below.
OA. One has 99% confidence that the sample mean weight of Pepsi in a can is equal to the
population mean weight of Pepsi in a can.
B. One has 99% confidence that the interval from the lower bound to the upper bound
contains the true value of the population mean weight of Pepsi in a can.
OC. Approximately 99% of sample mean weights of Pepsi in a can will fall between the lower
bound and the upper bound.
OD. There is a 99% chance that the true value of the population mean weight of Pepsi in a
can will fall between the lower bound and the upper bound.

Transcribed Image Text:Here are summary statistics for the weights of Pepsi in randomly selected cans: n=36, x=0.82409 lb, s = 0.00566 lb. Use a confidence level of 99% to complete parts (a) through (d) below.
a. Identify the critical value t/2 used for finding the margin of error.
¹a/2=
(Round to two decimal places as needed.)
Solution


