The main waiting time at the drive-through and the fast food restaurant from the time in order is placed to the time the order is received is 86.8 seconds a manager devices a new drive-through system that he believes will decrease weight time as a test initiate the new system that his restaurant image is the wait time for 10 randomly selected what is the wait times are provided in the table below 106.6,68.4,59.8,75.1,67.6,79.6, 96.1 ,84.2 ,72.0 ,80.6 assume the data is normally distributed is the new system effective based on the collected data perform an appropriate hypothesis test set up the Null and alternative hypothesis find the test statistic find the P -value.Use a 0.05 level of significance what can be concluded from this hypothesis test when you compare the P value with a significance level


The main waiting time at the drive-through and the fast food restaurant from the time in order is placed to the time the order is received is 86.8 seconds a manager devices a new drive-through system that he believes will decrease weight time as a test initiate the new system that his restaurant image is the wait time for 10 randomly selected what is the wait times are provided in the table below 106.6,68.4,59.8,75.1,67.6,79.6, 96.1 ,84.2 ,72.0 ,80.6 assume the data is
-value.Use a 0.05 level of significance what can be concluded from this hypothesis test when you compare the P value with a significance level
Given information-
Population mean, μ = 86.8
Sample size, n = 10
We have given the 10 randomly selected data of wait times.
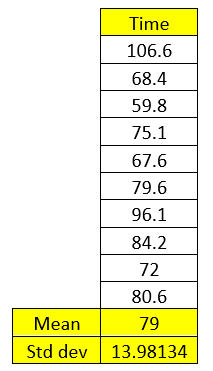
I have used following functions for mean and standard deviation.
=AVERAGE(106:80.6)
And standard deviation-
=STDEV.S(106:80.6)
Therefore,
Sample mean, x-bar = 79
Sample standard deviation, s = 13.9813
We have to test the claim that a new drive-through system that he believes will decrease weight time.
Hypothesis Formulation-
Null Hypothesis, H0: μ = 86.8
Alternate Hypothesis, Ha: μ < 86.8

Trending now
This is a popular solution!

Step by step
Solved in 2 steps with 2 images


