The length and width for a sample of products made by a certain company are plotted below: Length Width The correlation between length and width is calculated to be r = 0.827. Suppose we removed the point that is indicated by a p from the data represented in the plot. What would the correlation between length and width then be? O 0.827 O Larger than 0.827 O Smaller than 0,827 Either larger or smaller than 0.827; it is impossible to say which.
The length and width for a sample of products made by a certain company are plotted below: Length Width The correlation between length and width is calculated to be r = 0.827. Suppose we removed the point that is indicated by a p from the data represented in the plot. What would the correlation between length and width then be? O 0.827 O Larger than 0.827 O Smaller than 0,827 Either larger or smaller than 0.827; it is impossible to say which.

MATLAB: An Introduction with Applications
6th Edition
ISBN:9781119256830
Author:Amos Gilat
Publisher:Amos Gilat
Chapter1: Starting With Matlab
Section: Chapter Questions
Problem 1P

Related questions

Topic Video
Question
Can you please help me on question 12? Thank you

Transcribed Image Text:O The alleged cause is plausible.
O All of these answers are correct.
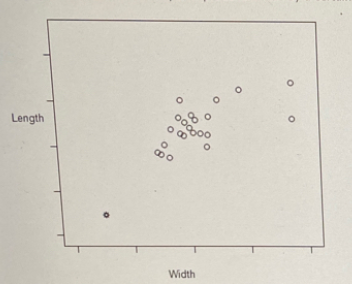
12. The length and width for a sample of products made by a certain company are plotted below:
Length
Ooboo
Width
The correlation between length and width is calculated to be r = 0.827.
Suppose we removed the point that is indicated by a from the data represented in the plot. What would the correlation between length and width then be?
O 0.827
O Larger than 0.827
O Smaller than 0,827
O Either larger or smaller than 0.827; it is impossible to say which.
13. In the National Hockey League, a good predictor of the percentage of games won by a team is the number of goals the team allows during the season. Data were gathered for all 30 teams in the NHL and the
scatterplot of their Winning Percentage against the number of Goals Allowed in the 2006/2007 season with a fitted least-squares regression line is provided:
70
65
60-
* 55-
Submit
Remaining: 1:06:00 Start: 10:41 PM
10:45 PM
ENG
局
P Type here to search
(16)
2/16/2021
Del
Pgup
F11
PgDn
F12
EsC
DII
PrtScn
Home
F9
End
Ins
F6
F7
FB
F10
F1
F2
F3
F4
F5
@
23
24
&
Back
2
4
7
8.
W
E
R
T
Y
U
Expert Solution
Step 1
Given scatter plot:
The length and width for a sample of products made by a certain company are plotted below.

Trending now
This is a popular solution!

Step by step
Solved in 2 steps with 1 images

Knowledge Booster


Learn more about
Need a deep-dive on the concept behind this application? Look no further. Learn more about this topic, statistics and related others by exploring similar questions and additional content below.Recommended textbooks for you
MATLAB: An Introduction with Applications
Statistics
ISBN:
9781119256830
Author:
Amos Gilat
Publisher:
John Wiley & Sons Inc

Probability and Statistics for Engineering and th…
Statistics
ISBN:
9781305251809
Author:
Jay L. Devore
Publisher:
Cengage Learning

Statistics for The Behavioral Sciences (MindTap C…
Statistics
ISBN:
9781305504912
Author:
Frederick J Gravetter, Larry B. Wallnau
Publisher:
Cengage Learning
MATLAB: An Introduction with Applications
Statistics
ISBN:
9781119256830
Author:
Amos Gilat
Publisher:
John Wiley & Sons Inc
Probability and Statistics for Engineering and th…
Statistics
ISBN:
9781305251809
Author:
Jay L. Devore
Publisher:
Cengage Learning
Statistics for The Behavioral Sciences (MindTap C…
Statistics
ISBN:
9781305504912
Author:
Frederick J Gravetter, Larry B. Wallnau
Publisher:
Cengage Learning

Elementary Statistics: Picturing the World (7th E…
Statistics
ISBN:
9780134683416
Author:
Ron Larson, Betsy Farber
Publisher:
PEARSON

The Basic Practice of Statistics
Statistics
ISBN:
9781319042578
Author:
David S. Moore, William I. Notz, Michael A. Fligner
Publisher:
W. H. Freeman

Introduction to the Practice of Statistics
Statistics
ISBN:
9781319013387
Author:
David S. Moore, George P. McCabe, Bruce A. Craig
Publisher:
W. H. Freeman