The initial reaction rate for the elementary reaction 2A + B-4C Was measured as a function of temperature when the concentration of A was 6 mol/L and the concentration of B was 3 mol/L. The data is given below: -TA (mol/L s): 0.0040 T (K): 600 0.0800 680 From the data, do the following: A) Plot In(k) vs. 1/T to create the Arrhenius plot 1.2000 760 16.00 840
The initial reaction rate for the elementary reaction 2A + B-4C Was measured as a function of temperature when the concentration of A was 6 mol/L and the concentration of B was 3 mol/L. The data is given below: -TA (mol/L s): 0.0040 T (K): 600 0.0800 680 From the data, do the following: A) Plot In(k) vs. 1/T to create the Arrhenius plot 1.2000 760 16.00 840
Introduction to Chemical Engineering Thermodynamics
8th Edition
ISBN:9781259696527
Author:J.M. Smith Termodinamica en ingenieria quimica, Hendrick C Van Ness, Michael Abbott, Mark Swihart
Publisher:J.M. Smith Termodinamica en ingenieria quimica, Hendrick C Van Ness, Michael Abbott, Mark Swihart
Chapter1: Introduction
Section: Chapter Questions
Problem 1.1P
Related questions
Question
100%
plz do via excel & label x & y axis deteremine slope,intercept, R^2
![The initial reaction rate for the elementary reaction:
\[ 2A + B \rightarrow 4C \]
was measured as a function of temperature when the concentration of A was 6 mol/L and the concentration of B was 3 mol/L.
The data is given below:
\[
\begin{array}{|c|c|c|c|c|}
\hline
-r_A \, (\text{mol/L} \cdot \text{s}) & 0.0040 & 0.0800 & 1.2000 & 16.00 \\
\hline
T \, (K) & 600 & 680 & 760 & 840 \\
\hline
\end{array}
\]
From the data, do the following:
(A) Plot \(\ln(k)\) vs. \(1/T\) to create the Arrhenius plot.](/v2/_next/image?url=https%3A%2F%2Fcontent.bartleby.com%2Fqna-images%2Fquestion%2Fd47fc2c3-8f4b-4085-b234-bc909be774e3%2Fde014cac-2c1e-4211-b3a3-0ad74504f22c%2F513nm9_processed.png&w=3840&q=75)
Transcribed Image Text:The initial reaction rate for the elementary reaction:
\[ 2A + B \rightarrow 4C \]
was measured as a function of temperature when the concentration of A was 6 mol/L and the concentration of B was 3 mol/L.
The data is given below:
\[
\begin{array}{|c|c|c|c|c|}
\hline
-r_A \, (\text{mol/L} \cdot \text{s}) & 0.0040 & 0.0800 & 1.2000 & 16.00 \\
\hline
T \, (K) & 600 & 680 & 760 & 840 \\
\hline
\end{array}
\]
From the data, do the following:
(A) Plot \(\ln(k)\) vs. \(1/T\) to create the Arrhenius plot.
Expert Solution
This question has been solved!
Explore an expertly crafted, step-by-step solution for a thorough understanding of key concepts.
This is a popular solution!
Trending now
This is a popular solution!
Step by step
Solved in 3 steps with 19 images

Follow-up Questions
Read through expert solutions to related follow-up questions below.
Follow-up Question
can you plz re-do
i am trying to copy in excel & i am getting some different trendline, r^2, & intercept
can you plz re-do your excel and please select to show the trendline and show it

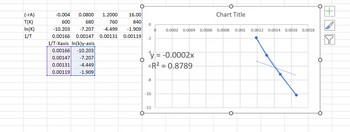
Transcribed Image Text:**Data Table:**
| (-rA) | -0.004 | 0.0800 | 1.2000 | 16.00 |
|--------|--------|--------|--------|--------|
| T(K) | 600 | 680 | 760 | 840 |
| ln(K) | -10.203| -7.207 | -4.499 | -1.909 |
| 1/T | 0.00166| 0.00147| 0.00131| 0.00119|
**Converted Data for Plot:**
| 1/T (X-axis) | ln(K) (Y-axis) |
|--------------|----------------|
| 0.00166 | -10.203 |
| 0.00147 | -7.207 |
| 0.00131 | -4.499 |
| 0.00119 | -1.909 |
**Graph Explanation:**
- **Type:** Scatter Plot
- **X-Axis:** Represents the values of 1/T.
- **Y-Axis:** Represents the natural logarithm of K, ln(K).
- **Trendline Equation:** y = -0.0002x
- Indicates a linear relationship with a negative slope.
- **R² Value:** 0.8789
- Suggests a strong correlation between 1/T and ln(K).
- **Data Points:** Four points plotted according to the values in the converted data table.
- **Trendline:** A linear trendline is drawn through the data points with dotted lines indicating the fit.
This graphical representation is typically used in kinetic studies to determine reaction rates and understand temperature dependence of a reaction, often applying the Arrhenius equation.
Solution
Follow-up Question
can you plz re-do
i am trying to copy in excel & i am getting some different trendline, r^2, & intercept
can you plz re-do your excel and please select to show the trendline and show it

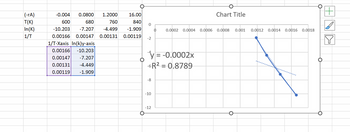
Transcribed Image Text:### Transcription for Educational Use
#### Data Table
- **(-rA):** Reaction rate values
- -0.004
- 0.0800
- 1.2000
- 16.00
- **T (K):** Temperature in Kelvin
- 600
- 680
- 760
- 840
- **ln(K):** Natural logarithm of the rate constant (K)
- -10.203
- -7.207
- -4.449
- -1.909
- **1/T:** Reciprocal of temperature
- 0.00166
- 0.00147
- 0.00131
- 0.00119
#### Additional Data for Graph
- **1/T-X axis:** Series used for plotting data on the X-axis
- 0.00166
- 0.00147
- 0.00131
- 0.00119
- **ln(k)-Y axis:** Series used for plotting data on the Y-axis
- -10.203
- -7.207
- -4.449
- -1.909
#### Graph Description
- **Chart Title:** Not specified
- **Axes:**
- X-Axis represents the reciprocal of temperature (1/T).
- Y-Axis represents the natural logarithm of the rate constant (ln(K)).
- **Data Points:**
- Represented by blue dots on the graph; four points are plotted corresponding to the given 1/T and ln(K) values.
- **Trendline:**
- A linear trendline is displayed crossing the data points.
- Equation: \( y = -0.0002x \)
- \( R^2 \) value: 0.8789, indicating the fit quality of the trendline to the data points.
This data and graph likely represent an Arrhenius plot used to analyze the temperature dependence of reaction rates.
Solution
Recommended textbooks for you

Introduction to Chemical Engineering Thermodynami…
Chemical Engineering
ISBN:
9781259696527
Author:
J.M. Smith Termodinamica en ingenieria quimica, Hendrick C Van Ness, Michael Abbott, Mark Swihart
Publisher:
McGraw-Hill Education

Elementary Principles of Chemical Processes, Bind…
Chemical Engineering
ISBN:
9781118431221
Author:
Richard M. Felder, Ronald W. Rousseau, Lisa G. Bullard
Publisher:
WILEY

Elements of Chemical Reaction Engineering (5th Ed…
Chemical Engineering
ISBN:
9780133887518
Author:
H. Scott Fogler
Publisher:
Prentice Hall

Introduction to Chemical Engineering Thermodynami…
Chemical Engineering
ISBN:
9781259696527
Author:
J.M. Smith Termodinamica en ingenieria quimica, Hendrick C Van Ness, Michael Abbott, Mark Swihart
Publisher:
McGraw-Hill Education

Elementary Principles of Chemical Processes, Bind…
Chemical Engineering
ISBN:
9781118431221
Author:
Richard M. Felder, Ronald W. Rousseau, Lisa G. Bullard
Publisher:
WILEY

Elements of Chemical Reaction Engineering (5th Ed…
Chemical Engineering
ISBN:
9780133887518
Author:
H. Scott Fogler
Publisher:
Prentice Hall


Industrial Plastics: Theory and Applications
Chemical Engineering
ISBN:
9781285061238
Author:
Lokensgard, Erik
Publisher:
Delmar Cengage Learning

Unit Operations of Chemical Engineering
Chemical Engineering
ISBN:
9780072848236
Author:
Warren McCabe, Julian C. Smith, Peter Harriott
Publisher:
McGraw-Hill Companies, The