The height (sidewalk to roof) of notable tall buildings in America is compared to the number of stories of the building (beginning at street level). Height (in feet) Stories 1050 55 428 27 362 26 529 40 790 60 401 22 380 38 1454 110 1127 100 700 46 Part (a) Using "stories" as the independent variable and "height" as the dependent variable, make a scatter plot of the data. Part (b) Does it appear from inspection that there is a relationship between the variables? YesNo Part (c) Calculate the least squares line. Put the equation in the form of: ŷ = a + bx. (Round your answers to three decimal places.) ŷ = + x Part (d) Find the correlation coefficient r. (Round your answer to four decimal places.) r = Is it significant? Yes or No ? Part (e) Find the estimated height for 34 stories. (Use your equation from part (c). Round your answer to one decimal place.) ft Find the estimated height for 92 stories. (Use your equation from part (c). Round your answer to one decimal place.) ft Part (f) Use the two points in part (e) to plot the least squares line. (Upload your file below.) Part (g) Based on the above data, is there a linear relationship between the number of stories in tall buildings and the height of the buildings? Yes or No? Part (h) Are there any outliers in the above data? If so, which point(s)? Select one of the following No, there are no outliers. Yes, (55, 1050) and (22, 401) are outliers. Yes, (55, 1050) is an outlier. Yes, (22, 401) is an outlier. Part (i) What is the estimated height of a building with 3 stories? (Use your equation from part (c). Round your answer to one decimal place.) ft Does the least squares line give an accurate estimate of height? Explain why or why not. . The least squares regression line does not give an accurate estimate because the estimated height of a building with three stories is not within the range of y-values in the data. . The estimate for the height of a three-story building does not make sense in this situation. . The least squares regression line does not give an accurate estimate because a three-story building is not within the range of x-values in the data. . The least squares regression line does give an accurate estimate because none of the buildings surveyed had three stories. Part (j) Based on the least squares line, adding an extra story adds about how many feet to a building? (Round your answer to three decimal places.) ft Part (k) What is the slope of the least squares (best-fit) line? (Round your answer to three decimal places.) Interpret the slope. As the (---Select---) of the building increases by one unit, the ( ---Select---) of the building increases by (---Select---) Select from the following height feet number of stories stories


Correlation
Correlation defines a relationship between two independent variables. It tells the degree to which variables move in relation to each other. When two sets of data are related to each other, there is a correlation between them.
Linear Correlation
A correlation is used to determine the relationships between numerical and categorical variables. In other words, it is an indicator of how things are connected to one another. The correlation analysis is the study of how variables are related.
Regression Analysis
Regression analysis is a statistical method in which it estimates the relationship between a dependent variable and one or more independent variable. In simple terms dependent variable is called as outcome variable and independent variable is called as predictors. Regression analysis is one of the methods to find the trends in data. The independent variable used in Regression analysis is named Predictor variable. It offers data of an associated dependent variable regarding a particular outcome.
| Height (in feet) | Stories |
|---|---|
| 1050 | 55 |
| 428 | 27 |
| 362 | 26 |
| 529 | 40 |
| 790 | 60 |
| 401 | 22 |
| 380 | 38 |
| 1454 | 110 |
| 1127 | 100 |
| 700 | 46 |
-
Part (a)
Using "stories" as the independent variable and "height" as the dependent variable, make ascatter plot of the data.-
Part (b)
Does it appear from inspection that there is a relationship between the variables?YesNo -
Part (c)
Calculate the least squares line. Put the equation in the form of:ŷ = a + bx.(Round your answers to three decimal places.)
ŷ = + x -
Part (d)
Find thecorrelation coefficient r. (Round your answer to four decimal places.)
r =
Is it significant?Yes or No ? -
Part (e)
Find the estimated height for 34 stories. (Use your equation from part (c). Round your answer to one decimal place.)
ft
Find the estimated height for 92 stories. (Use your equation from part (c). Round your answer to one decimal place.)
ft -
Part (f)
Use the two points in part (e) to plot the least squares line. (Upload your file below.)
-
Part (g)
Based on the above data, is there a linear relationship between the number of stories in tall buildings and the height of the buildings?Yes or No? -
Part (h)
Are there any outliers in the above data? If so, which point(s)? Select one of the followingNo, there are no outliers.Yes, (55, 1050) and (22, 401) are outliers.Yes, (55, 1050) is an outlier.Yes, (22, 401) is an outlier. -
Part (i)
What is the estimated height of a building with 3 stories? (Use your equation from part (c). Round your answer to one decimal place.)
ft
Does the least squares line give an accurate estimate of height? Explain why or why not.. The least squares regression line does not give an accurate estimate because the estimated height of a building with three stories is not within therange of y-values in the data.. The estimate for the height of a three-story building does not make sense in this situation.. The least squares regression line does not give an accurate estimate because a three-story building is not within the range of x-values in the data.. The least squares regression line does give an accurate estimate because none of the buildings surveyed had three stories. -
Part (j)
Based on the least squares line, adding an extra story adds about how many feet to a building? (Round your answer to three decimal places.)
ft -
Part (k)
What is the slope of the least squares (best-fit) line? (Round your answer to three decimal places.)
Interpret the slope.As the (---Select---) of the building increases by one unit, the ( ---Select---) of the building increases by (---Select---)Select from the followingheightfeetnumber of storiesstories
-
Hey, since there are multiple subparts posted, we will answer first three subparts. If you want any specific subpart to be answered then please submit that subpart only or specify the subpart in your message.
a)
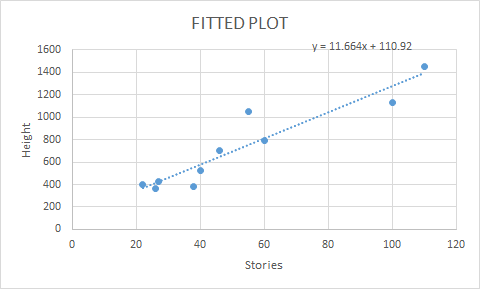
Step-by-step procedure to draw the fitted line plot using Excel:
- In Excel sheet, enter and select Height in one column and enter Stories in one column.
- In Insert, select Scatter with only markers under Scatter.
- Right click the points in the graph and select Add trend line.
- Select Linear in Trend/Regression Type.
- Click Display Equation.
- Click Ok.
Output obtained using Excel is given below:

Trending now
This is a popular solution!

Step by step
Solved in 2 steps with 1 images


